Diagnosing JavaScript Errors / Console Errors
It may happen that the issues may not be related to our plugin but due to some JavaScript / Console errors, browser issues or issues due to other plugins.
For example, broken flyout menus, broken plugin menu, non-draggable metaboxes, media buttons not working, offers not showing up, coupons not applying correctly, specific plugin functionality not working…can be anything. Sometimes, the same error may not be present in another browser.
So, we request you to follow the guide below to diagnose the JavaScript / Console errors and then reach out to the support team. That will resolve your query at the earliest.
Follow the steps below to diagnose JavaScript / Console issues or conflicts in different browsers.
Try a different browser
This is to ensure it is a JavaScript / Console error and not any browser error.
- If the plugin does not have the same issue in another browser, the error is browser-specific.
- If the plugin shows the same error in another browser, it is not a browser-specific error. It can be a JavaScript / Console related error.
Make a note of the browsers you are experiencing the error in. You can use this information in your support request.
Checking Console to find errors
You now know which browsers you are facing issues on. So you can start to diagnose them.
For Chrome, Edge, Firefox and Safari, the steps to identify error remains the same. How to open the Console steps are different.
Chrome and Edge
Open the DevTools
Press Command+Option+J (Mac) or Control+Shift+J (Windows, Linux, Chrome OS) to jump straight into the Console panel of Chrome DevTools.
You can also navigate to More Tools > Developer Tools from the Chrome menu, and click the Console tab.
Firefox
Open the Web Console
Press Command+Option+K(Mac) or Control+Shift+K (Windows) to jump straight into the Console panel of Firefox Web Console.
You can also navigate to Web Development > Web Console from the Firefox menu, and click the Console tab.
Safari
Enable Developer Tools
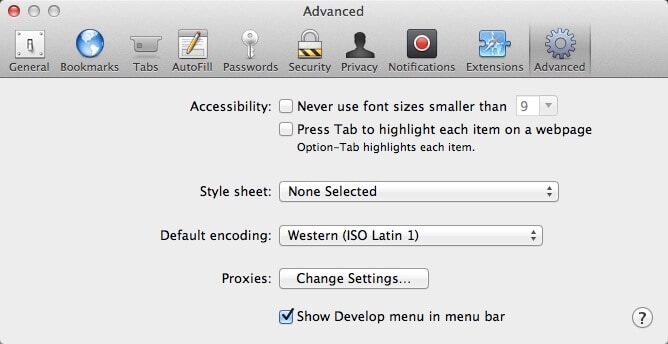
Navigate to Safari > Preferences > Advanced and check the box that says Show Develop in the menu bar.
Open the Console
Go to the screen where you are experiencing the error. In Safari, navigate to Develop > Show Error Console.
Identify the Error for Chrome, Edge, Firefox and Safari
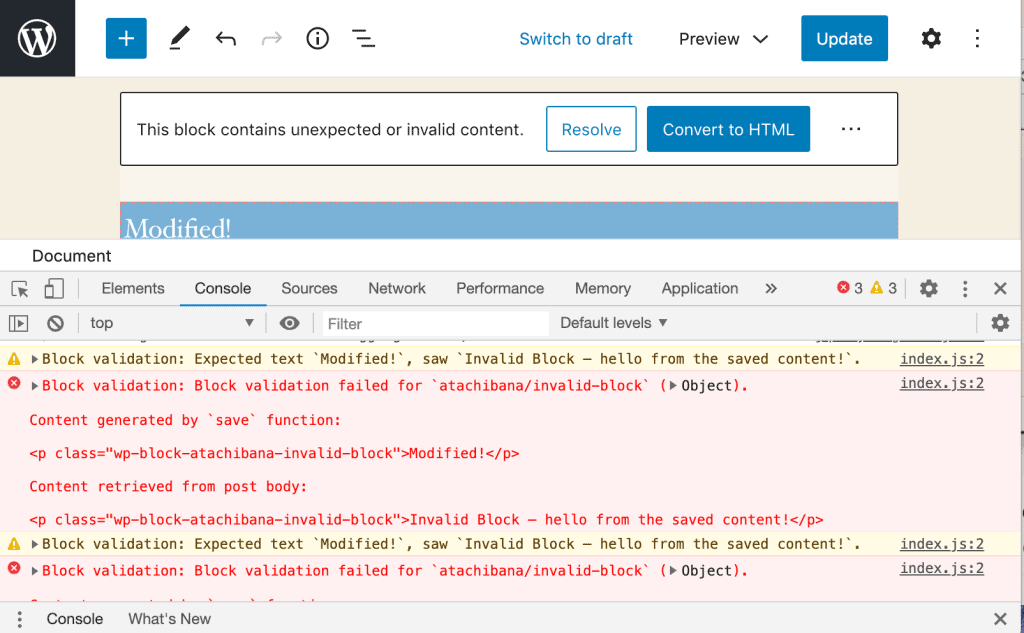
- The error console will open. Try reloading the page if you don’t see any errors. The error may be generated when the page loads.
- The console will provide you with the error type, the location of the error and the line number.
- Take a screenshot if you see any entries in ‘red’ color and simply send it along with the support request.
Note: If you cannot see the error, click the back button within the console.
Opera
1. Open the Console
Go to the screen where you are experiencing the error. In Chrome, navigate to Tools > Advanced > Error Console.
2. Identify the Error
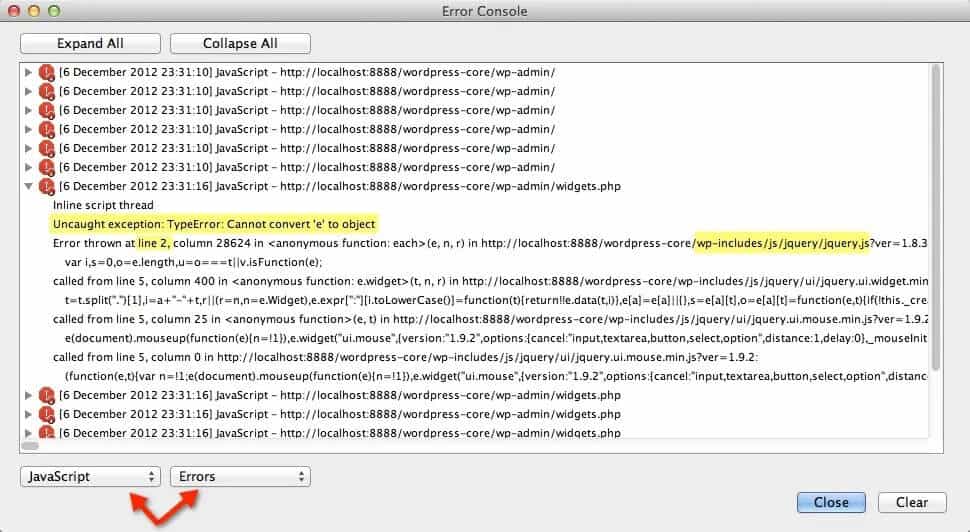
The error console will open. Select JavaScript and Errors from the two drop-downs. To find the error location, expand one of the errors. You’ll see the error and the location.
However, remember to copy the whole stack information! Just saying what line is less helpful than showing context.
Internet Explorer
Note: WordPress officially dropped support for Internet Explorer 11 in WordPress 5.8. If you are currently using IE11, it is strongly recommended that you switch to a more modern browser, such as Google Chrome, Mozilla Firefox, Safari, or Microsoft Edge.
Enable SCRIPT_DEBUG
Note – This is for advanced debugging and we request you to try first on staging or testing sites.
You need to turn on script debugging. Open wp-config.php and add the following line before “That’s all, stop editing! Happy blogging”.
define('SCRIPT_DEBUG', true);
Check to see if you are still having an issue.
- If the issue is fixed, turn off script debugging and tell the support team that turning on script debugging solved the problem.
- Issue persists – proceed to the Diagnosis mentioned above.
Reporting
Now that you have diagnosed your error, you can contact the support team.
Please include the below information:
- the browsers wherein you faced a problem
- the JavaScript / Console error
- screenshot showing the error messages
- whether SCRIPT_DEBUG fixed the error or not if enabled
Article references – WordPress.com and WPMU DEV.com