Google Analytics 4 or GA4 seems to stay at least till 2028.
This is based on the average lifespan of 8 years for each Google Analytics version – Urchin(1997), Classic(2005), Universal(2012) and now Google Analytics 4(2020).
Like it or don’t like it (most of us don’t when compared to Google Universal Analytics or GA3), but you can’t avoid it.
Who knows five years down the line, analytics will speak out insights and give you action items to improve your traffic and sales. Afterall, GA4 has taken the AI route more deeply.
Honestly speaking, my first impression of GA4 was also not that great.
But, there are some really important GA4 metrics, maybe better than Universal Analytics you can track for your business growth. We’ll drill down to those metrics in this article.
Because making decisions without analytics is like shooting arrows in the dark.
We’ll also cover some basics of GA4 and answers to your most burning questions first in a quick overview.
Ready, set, go!
What is Google Analytics 4…what makes it different from Universal Analytics…what about data privacy…let’s have a look.
What is Google Analytics 4 property? Why did Google introduce it?
Google Analytics 4 or GA4 is the latest version of Google Analytics(GA), a new property designed for the future of measurement.
It collects both website and app data to better understand the customer journey. It uses events instead of session-based data and also includes privacy controls such as cookieless measurement and behavioral and conversion modeling.
Now, Universal Analytics was getting into hot water with the EU over the issue of privacy.
So Google Analytics 4 is designed with privacy at its core to provide a better experience for both customers and their users. It helps businesses meet evolving needs and user expectations, with more comprehensive and granular controls for data collection and usage.
Importantly, Google Analytics 4 will also no longer store IP addresses. These solutions and controls are especially necessary as users are expecting more privacy protections and control over their data.
Is Google Analytics 4 replacing Universal Analytics?
Yes, from July 23, 2023, we would bid an emotional goodbye to Universal Analytics forever. And would have to start using GA4 even if we do not want to unless you switch to alternatives.
Google Analytics 4 vs Universal Analytics – what’s the difference?
The primary difference between Google Analytics 4 and Universal Analytics is the tracking model. Universal Analytics is session based while Google Analytics 4 is event based.
Other differences relate to cross-domain reporting (no need of separate property in GA4 for subdomains), predictive audience and other parameters.
Putler, sister brand of StoreApps has done a solid comparison of Google Analytics 4 vs Universal Analytics and also the challenges associated with both the properties.
Should I stop using Universal Analytics?
Absolutely not! GA4 is under development and behind what Universal Analytics offers. Tracking in GA4 will start from zero when you set up for your website and apps.
So, it’s highly recommended you keep tracking both the properties and also compare data to have better insights.
Since 23rd July, 2023 is the last date, we suggest setting up GA4 now so as to have a one year comparison of data.
How to migrate to GA4? What will happen to my existing data?
All Universal Analytics (UA) properties can be upgraded to GA4, meaning a new Analytics property will be created for collecting the new data and your current GA account will not be affected.
If you previously had a Firebase Analytics account (for apps), this will have been automatically upgraded to GA4.
There ain’t any tool to migrate data from Universal Analytics to GA4. You’ll lose all your existing data once Google pulls the switch off Universal Analytics.
What if I want to stick to Universal Analytics and not switch to GA4?
Yes, you can but only till July 1, 2023, After that, standard Universal Analytics properties will no longer process data. However, new data will only flow into Google Analytics 4 properties.
So better to start now and think of it as GA4 training!
What are the advantages of switching to GA4?
- Single property to track all subdomains in one
- Automatic tracking of certain type of events
- Free connection to BigQuery to access raw data and run SQL queries on it
- Predictive analytics capabilities
and many more…
View all the advantages of Google Analytics 4.
What are the drawbacks of GA4?
Some major ones include:
- Very challenging to navigate and understand data, user experience also not that great.
- No simple way to migrate data from Universal Analytics
- Problems related to GDPR, privacy and compliance
- Lack of features as compared to Universal Analytics like Enhanced Ecommerce
Long story short, there’s no other way if you want to stay in Google’s world of analytics.
Else, you need to try Google Analytics alternatives like Plausible, Piwik, Heap, Woopra and others.
How to properly install, set up and use GA4?
Now, installing and setting up GA4 is a blog in itself. Adding all with images will drag it too long here.
So, for time-being, you can refer to this latest video on how to install GA4.
GA4 metrics, dimensions and events
Every report in Analytics is made up of dimensions and metrics. Even an event is measured by dimensions and metrics. For example, ‘Event name’ is a dimension.
Since the data is collected and processed differently, some once-familiar metrics are now gone.
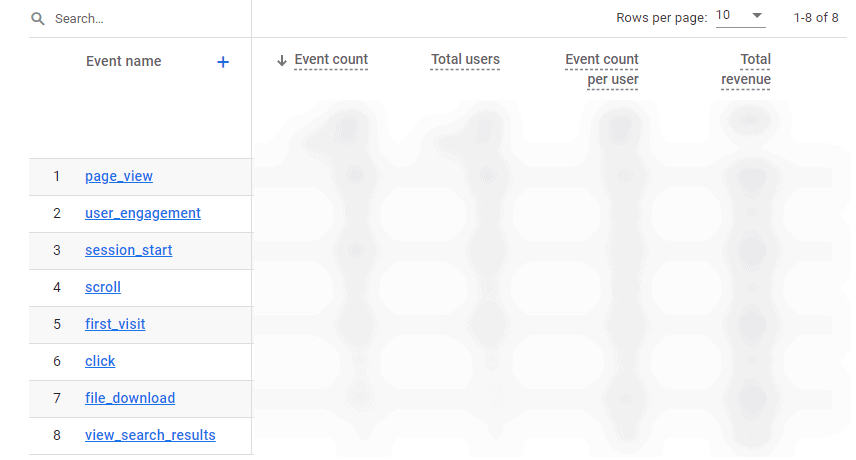
GA4 events
Everything in GA4 is event based. A pageview, purchase, click, etc.
In GA4, events can be split into 4 categories:
- Automatically collected events – automatically tracked. First time users, session start…
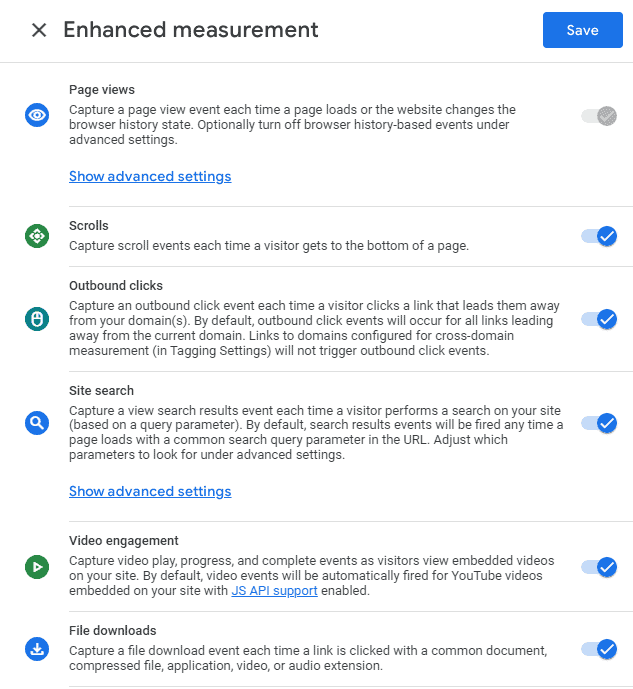
- Enhanced Measurement events – automatically tracked, allows marketers to get as many events in the reports as possible without developer assistance. Pageviews, scrolls, outbound clicks…
- Recommended events – if an event does not cover the above two cases, use recommended events. Login, purchase, join a group…
- Custom events – if an event is not mentioned in the above three categories, use custom events. Best example could be tracking a call-to-action button on the bottom of a high-ranking blog post.
Though GA4 provides flexibility in setting up events, you require Google Tag Manager and Debug view for testing events. A developer or analytics expert view is a valuable addition to check all is in place.
Found this awesome and in-depth guide on setting up and testing GA4 events. It will clear all your doubts related to GA4 events.
GA4 dimensions
Dimensions are attributes of your data. It might be a feature of a user, website, product, event, etc. It helps us better describe and understand our data so it makes sense to look at it as a qualitative variable.
For example, the dimension ‘Country’ indicates the country, for example, India or The United States, from which a session originates. The dimension ‘Page’ indicates the URL of a page that is viewed.
GA4 metrics
Metrics are quantitative measurements. The metric ‘Sessions’ is the total number of sessions. The metric ‘Pages/Session’ is the average number of pages viewed per session.
The tables in most Analytics reports organize dimension values into rows and metrics into columns. For example, a dimension (Country) and two metrics (Sessions and Pages/Session).
GA4 custom dimensions and metrics
In most Analytics reports, you can change the dimension and/or add a secondary dimension.
However, if you want to collect information that Analytics doesn’t capture with these dimensions and metrics, you can create your own custom dimensions and metrics.
Some dimensions and metrics are populated automatically when you add the global site tag (gtag.js) to your website or add the Google Analytics for Firebase SDK to your mobile or web application.
Other dimensions and metrics require some configuration before they’re populated.
Refer to this guide on setting up custom dimensions and metrics.
Tracking the crucial GA4 metrics, dimensions and events – making the most out of GA4
There are 100+ dimensions and metrics in Google Analytics 4 that spans across events, ecommerce, demographics, gaming, advertising and so on. It’s very easy to get lost in that maze.
If we go for each, this blog will go towards infinity.
But at least, we can track some crucial ones that form the backbone of any business and identify some growth opportunities.
In-fact, some of these are quite the basic ones, just that we need to spin our heads a little bit more now to understand them better. So here we go with the shortlisted eleven.
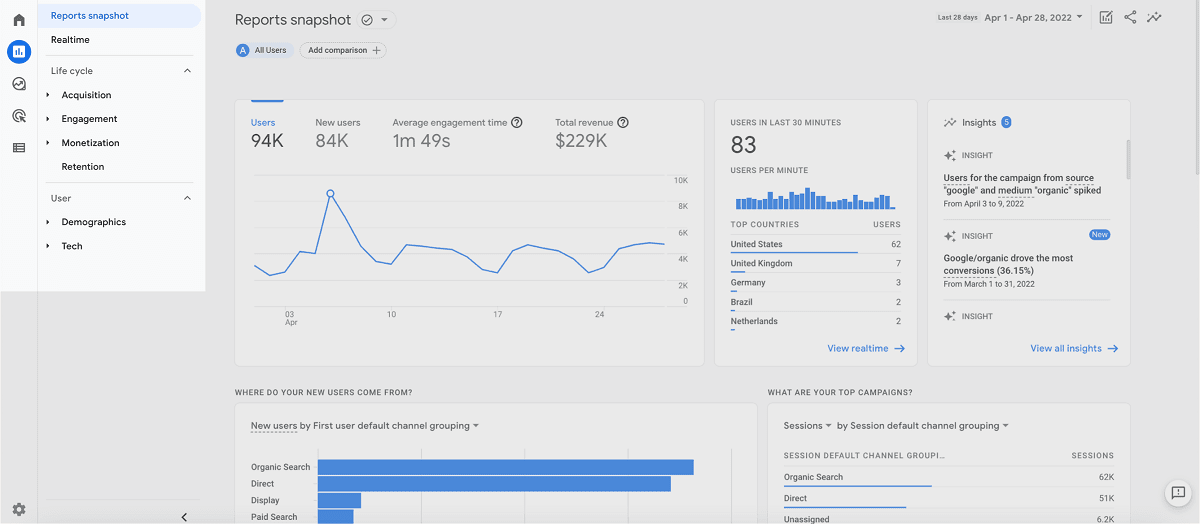
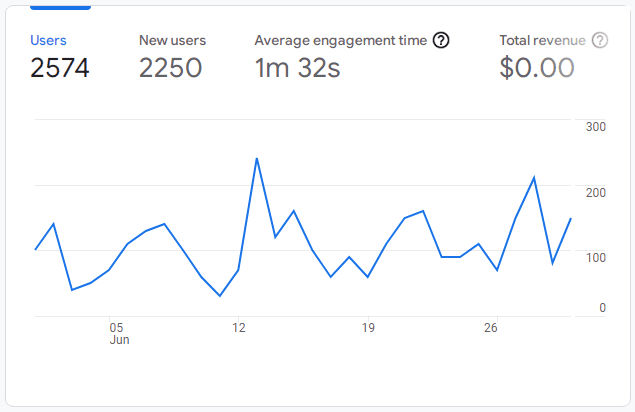
Users (Active Users) – Monitor traffic growth from campaigns
The most important metric of all that takes the center stage in GA4 – how much traffic your website receives?
Now, ‘Users’ metric in GA3 and GA4 is very different.
In GA3, Users(Total users) stands for both new + returning users for a date range.
While in GA4, Users stands for Active Users for a date range. Active users means those users who had an engaged session (lasts more than 10 seconds, did more than one pageview, etc.)
So when you compare GA4 users count and GA3 users counts, you may observe a difference.
Now, to compare total users in GA3 vs GA4, you need to use the Exploration reports in GA4.
How is this report useful?
Google breaks your active users into different time frames – 1-day, 7-day, and 30-day active user count so you can easily see how many users visited your site in that period.
This helps you determine the retention rate of your site and mobile apps. You can see how frequently a user returns to your site with ease.
For example, say you set up a campaign for your new product – landing page, blog, some social and email promotion a few days ago. If you hover over the chart, you can see the three different metrics.
If your 7-day and 30-day active users have increased since the new campaign launch, then you know it’s had some impact.
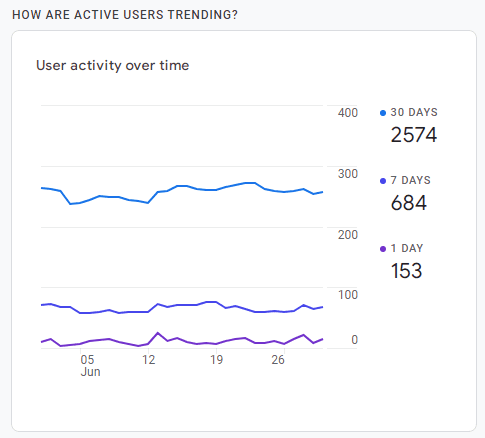
You can delve further into your reports to see how much and from where. This report will surely be your top priority when you open GA4 anytime.
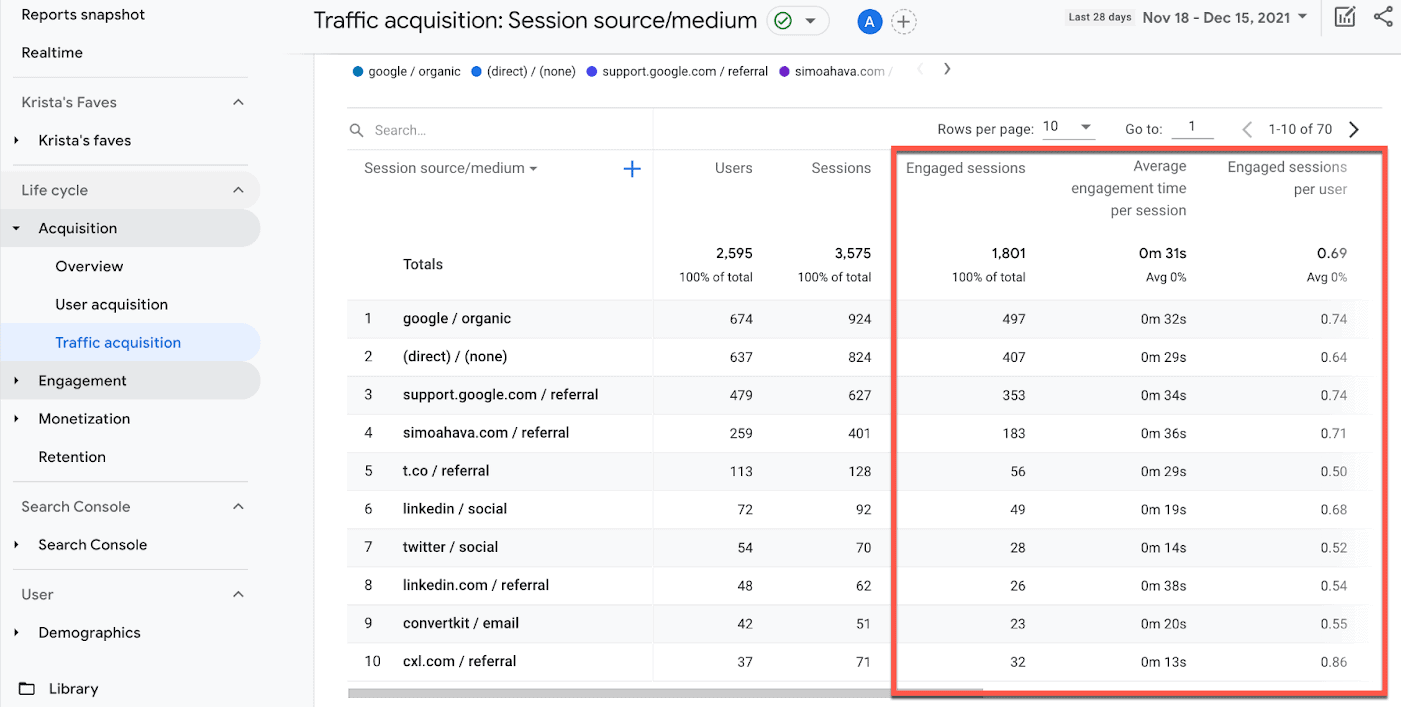
Sessions – Identify the best acquisition source
An interesting thing about Sessions is that in Google Analytics 4, there are three main session related metrics:
- Sessions – the number of sessions that began on your site or app (event triggered: session_start).
- Engaged sessions – the number of sessions that lasted longer than 10 seconds, or had a conversion event, or had 2 or more screen views.
- Engaged sessions per user – The average number of engaged sessions per user.
This metric itself has been considerably improved in comparison with UA, as new sessions are not initiated in GA4 if the same user comes from a different traffic source or keeps browsing your webpage at midnight.
However, each visit counts as one session which means if the customer uses a desktop first and then a phone, two sessions will be counted.
Now, both GA3 and GA4 differ in session timeout also:
- Google Analytics 4: on default 30 minutes -> Minimum: 5 minutes, Maximum: 7 hours and 55 minutes
- Universal Analytics: on default 30 minutes -> Minimum: 1 minute, Maximum: 4 hours
So make sure to set the session timeout to the same value in both tools.
How is this report useful?
The GA4 sessions metric is crucial as it indicates which acquisition channel brings more traffic to you and spot some trends in your users’ behavior.
Whether it is organic search, paid search, organic videos or affiliates. Each session has a time limit that you can choose, with the default being 30 minutes.
Engagement rate – Identify if your content is meeting user expectations
The metric Bounce Rate in GA3 is not present in GA4. Instead, it has come up with a new meric called ‘Engagement Rate’ that enables you to identify how your customers are interacting with your content.
It is also important to understand what an engaged session is in GA4.
A session is considered to be engaged if one of the following conditions is met:
- Lasted longer than 10 seconds
- Resulted in 1 or more conversion events
- Resulted in 2 or more page/screen views
How is this report useful?
The GA4 engagement rate is calculated in the following way: Engaged sessions divided by Sessions. For example, if you had 300 engaged sessions, and 1,000 total, your engagement rate would be 30%
Gives us more information about true interaction with the webpage rather than users simply exiting the website.
In this way, you can identify if your content is meeting the expectations of your users. Then, you can optimize the page accordingly.
Outbound clicks – Spot opportunities for affiliate products and backlinks
Outbound clicks or External Links clicks are automatically tracked in Google Analytics 4 under ‘Enhanced Measurement’ unlike GA3 wherein you need to set them up via Google Tag Manager.
This event will show up as a ‘Click’ event in your reports. You will be able to see this Event all of its parameters in the real-time reports. This event will also show up in the ‘Events’ report as well as in the ‘Engagement’ report.
Now, if you click the ‘click’ event, it will open a report where you won’t see what kind of links were clicked.
If you want to see what links were clicked and how many times that occurred, you will need to create a custom report in the Explore section. Here’s how to create outbound clicks event in GA4.
How is this report useful?
- If you are selling affiliate products, you mention them on your website. So you know which product links get the most clicks and which one the lowest. Make decisions accordingly.
- If not for affiliate products, people visit external resources or other relevant links you insert in your blog post. Reach out to them for a backlink to your site for building website authority.
Site search – Find user intent and missing website content
This is yet another interesting feature in Google Analytics 4.
Using this metric, you can determine the search terms used by your website visitors to find information on your website.
How is this report useful?
Site search should not only be tracked in regards to search engines but also within your website.
Internal site searches can reveal a lot about your visitors. From what their intent is to what is lacking on your website.
If visitors arrive on your website from an organic search or from social media, there was a specific piece of content that caught their interest.
If they found your content to have potential and provided them with significant value then they might be willing to look through your website through the search bar.
So, these search terms become valuable keywords that you can then focus future content on.
The same applies to WooCommerce, Shopify, SquareSpace or any ecommerce store that visitors may be looking out for some products for that search terms.
Percent scrolled (Unique user scrolls) – Add proper call to actions
This metric will find takers in blog writers and SEO enthusiasts.
This dimension is populated automatically by the scroll event if enhanced measurement is enabled.
If someone scrolls at least 90% of a page, the value ’90’ populates the dimension. Otherwise, the dimension is blank.
For other thresholds as well (e.g. 25%, 50%, 75%), you need to implement it via Google Tag Manager.
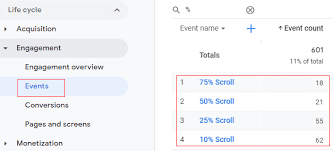
How is this report useful?
If this number is high, it means you have kept your users engaged on this page. Congratulations.
So next up is to have the call-to-action to nudge users to take an appropriate action.
User stickiness – Insights on returning visitors
This is a new dimension that GA4 released and I’m becoming a fan of it. User stickiness refers to users based on how frequently they access your site.
In particular, this chart looks at how many users visit your site on a daily, weekly, and monthly basis. This chart also provides you with ratios to make easy comparisons. These ratios include:
- Daily active users (DAU) / Monthly active users (MAU)
- Daily active users (DAU) / Weekly active users (WAU)
- Weekly active users (WAU) / Monthly active users (MAU)
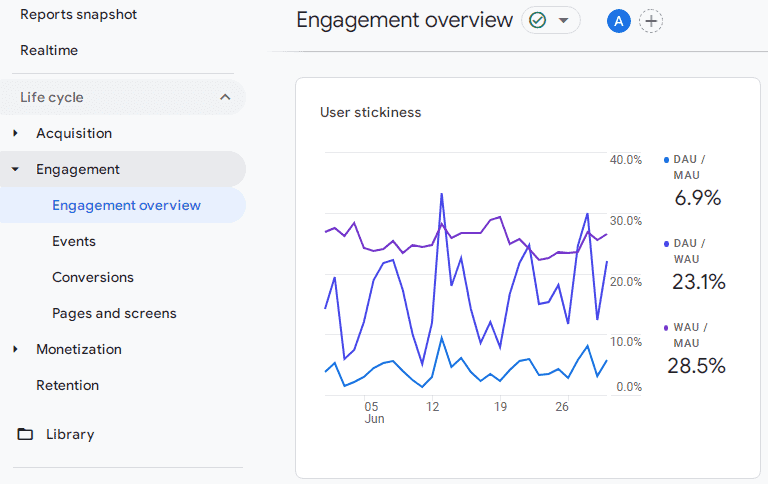
How is this report useful?
You can quickly see how changes and new efforts are affecting your visitors and how loyal they are to your brand.
Again, if you hover over the chart, you’ll see data appear automatically based on the date. If you have a high percentage for the ratios mentioned above, it means users are happily engaging with your site and returning on a regular basis.
Views(Page title and screen class) – Discover the best and worst performing pages
This metric is very straightforward. It shows the number of times a webpage or an app screen was viewed by your users.
The only downside of this metric is it cannot keep track of any unique view.
This means if one customer logs in and out of your website 10 times, it’ll show 10 additional views. Just like a view count on YouTube, this is more of a vanity metric than anything.
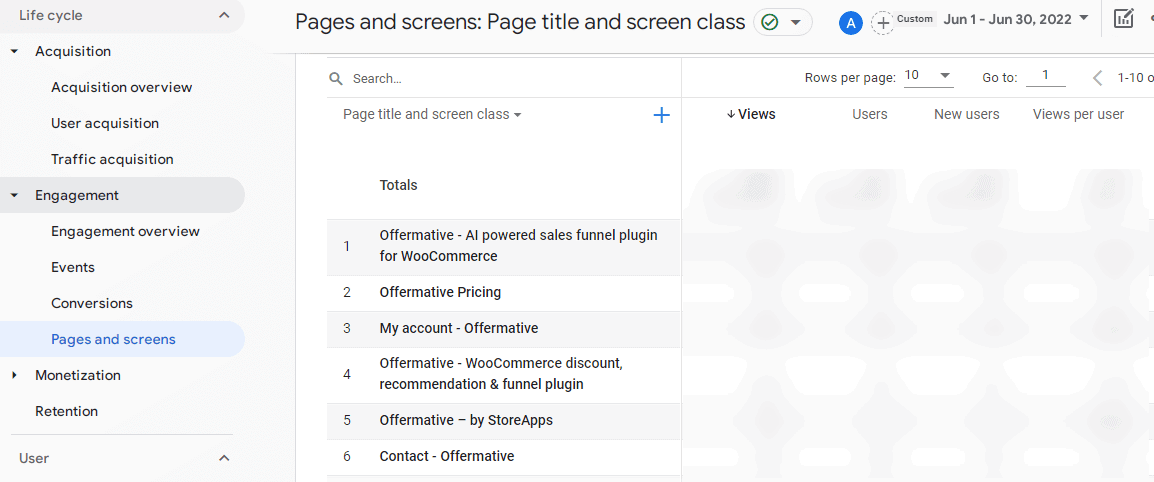
How is this report useful?
This report still helps to know that your site reached a certain view level within a set timeframe like, say, a quarter or an entire year even.
Moreover, views can help you identify how your webpage is performing and how website changes might be impacting your user behavior.
If a certain page is getting so many views within a short period of time, there is something tremendously useful for the readers.
The views by page is also a good gauge to understand where sudden spikes of traffic came from as you can compare week-over-week performance of each individual page.
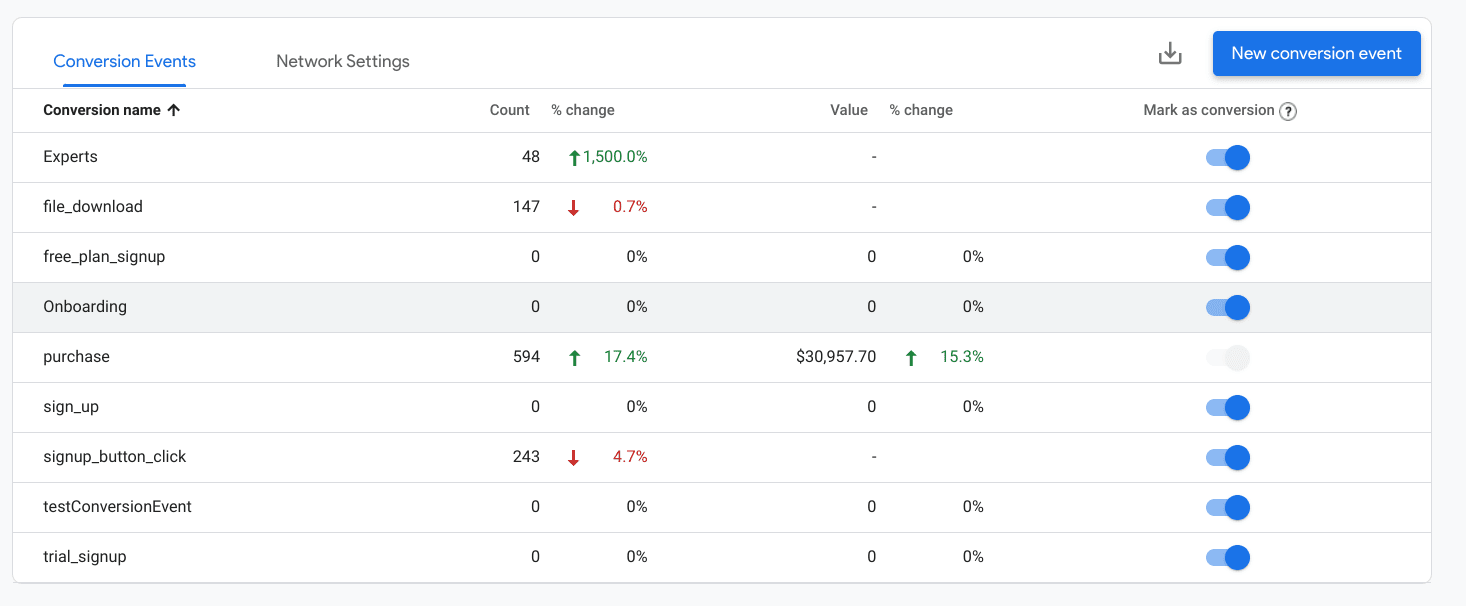
Conversions – Track purchases, advertising campaigns and more
Goals in GA3, now called Conversions in GA4. The GA4 conversions metric shows you the number of times a user triggered an event on your webpage or app.
You could create up to 20 goals per GA view. In GA 4, that limit is 30 conversions per property.
In GA4, there are some predefined conversions for webpage and mobile app that cannot be disabled. For example, purchases is the only conversion metric for web data streams connected to the property.
Other conversions that can be turned on (or you can enter the event name manually)
So, for example, if you have an event called ebook_downloaded, then you can flip the switch and turn it into a conversion.
However, in GA4, setting conversions for an event shows all in general. For example, if you set pageviews as conversion, it will turn any pageview into conversion.
If you want to separate your ‘Thank you page’ from that conversion list to count actual purchases, you can either send a dedicated event (with a different name) from Google Tag Manager/Gtag.js, or you can use the Create Event feature in the GA4 interface.
For more details, watch this video on GA4 conversion tracking.
Note – We’ll soon add a simple version of event and conversion tracking with examples soon.
How is this report useful?
By tracking conversions, you can better understand what is working for your business and what isn’t.
For example, you can create a segment of your users who have made a purchase and then try to understand what they are doing, what is their behavior, etc. Also, conversions are used to measure the effectiveness of advertising campaigns and then redistribute your advertising budget.
Another example could be how many users land on a popular landing page and downloading a resource after giving their email address.
So if you want to configure conversions, you first must configure event tracking in Google Analytics. Then you will need to instruct GA4 that some events are more important than others.
Lifetime Value – Look into the future
This is where GA4 goes beyond GA3 by a great extent.
This metric measures the lifetime value of each customer that visits your website. Depending on what you sell and each customer’s life cycle, you can collect this data on Google Analytics.
The GA3 Lifetime Value Report only contains historical data. But GA4 uses machine learning to predict the likelihood of future purchases, activity, and revenue by analyzing past behavior of users.
You need to have at least 1,000 users who return to your site or app and 1,000 users who do not return in a given period (7 or 28 days) in order to successfully train predictive models.
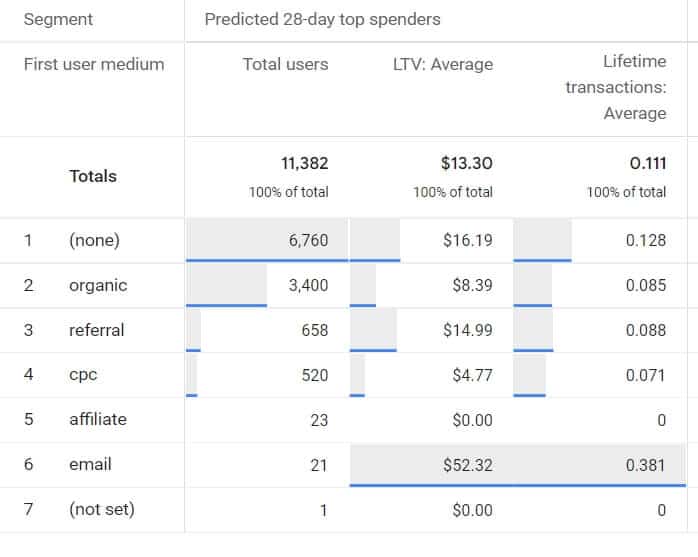
How is this report useful?
You can use this metric in combination with acquisition sources to identify the most effective allocation of your marketing resources to get those users.
By analyzing the GA4 lifetime value, you can also determine which methods bring you high-level users. It also helps you determine how much money you should invest to acquire a new user.
The lifetime value of each customer increases if you shorten the current buying cycle.
Setting up a lifetime value report itself is a big blog. Until we come up with a short and sweet version of it, refer to this in-depth guide on understanding GA4 lifetime value report and Google’s predictive metrics page.
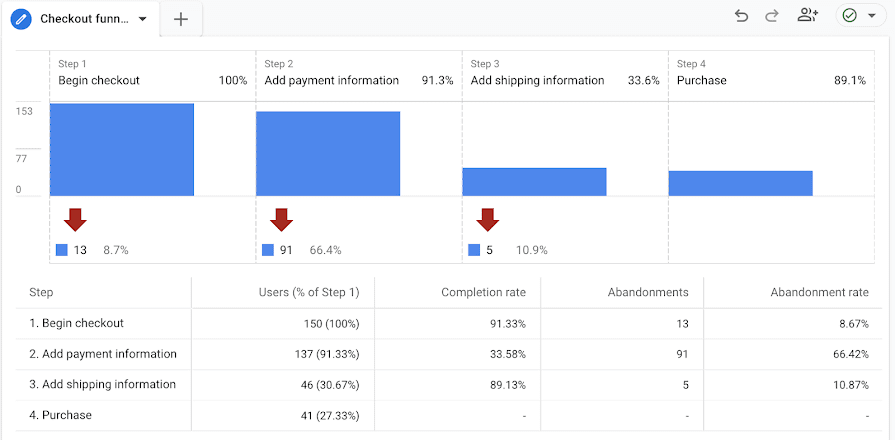
Ecommerce – cart, checkout, transactions, ARPU
No analytics is complete without ecommerce tracking.
Tracking in GA4 is also quite different from GA3 like in-depth funnels, funnel customization and so on.
But how many carts were abandoned, how many users abandoned checkout, what was the overall conversion rate…you can track these basic metrics.
To collect ecommerce data, you need to add ecommerce events to your website or app or in your Google Tag Manager container. Because these events require additional context to be meaningful, the events aren’t sent automatically.
Once you add the events and someone uses the website or app, you will start to see ecommerce data in Analytics.
Learn more about setting up ecommerce events in GA4.
Winding up
To sum up, you must always rely on data to analyze your business performance and should always begin with identifying the key metrics for your reports.
Agreed, GA4 is not that easy and great too. But it is useful as well as seen from the above blog. Some advanced customizations can really help you take it to the next level. AI-powered predictions can help you dig deeper, understand your customers and thus boost your marketing strategies.
This is a developing blog. I’m also learning GA4 in more detail and will keep on updating this post based on my learnings and what Google keeps on updating.
Also, a big thank you to all those resources out there who are helping individuals make sense of Google Analytics 4.
If you feel your knowledge about GA4 increased by even the narrowest of margins, I would feel more than happy.
Do share your experience reading the blog or any feedback you have in the comments below.