WooCommerce is the most popular and user-friendly e-commerce platform for selling products. But what if you’re running a WooCommerce business and need the latest metrics or insights about your business or customers?
How about analyzing customer orders, subscriptions, MRR, and other key KPIs?
Until now, you were limited to default WooCommerce reports and analytics.
The basic WooCommerce reporting is still quite elementary and falls short for fast-paced entrepreneurs or online sellers thriving with increased sales and revenue.
Is there a better solution to elevate your business with advanced WooCommerce analytics?
In fact, there exist a few options. Putler and the advanced WooCommerce reporting are both useful analytics tools. Putler, however, is far more sophisticated and all-encompassing.
And why do we say that? Read below to find out.
Old vs new WooCommerce analytics and reports
Since the release of WooCommerce 4.0 during the first COVID-19 wave, the default WooCommerce reports have been deprecated and won’t receive further updates.
There is a new and better Analytics section for users running WordPress 5.3+.
Let’s see the difference between these old and new WooCommerce analytics reports:
Old WooCommerce reports
The default WooCommerce reports included four sections: Orders, Customers, Stock, and Taxes.
To view these reports, go to WooCommerce > Reports.
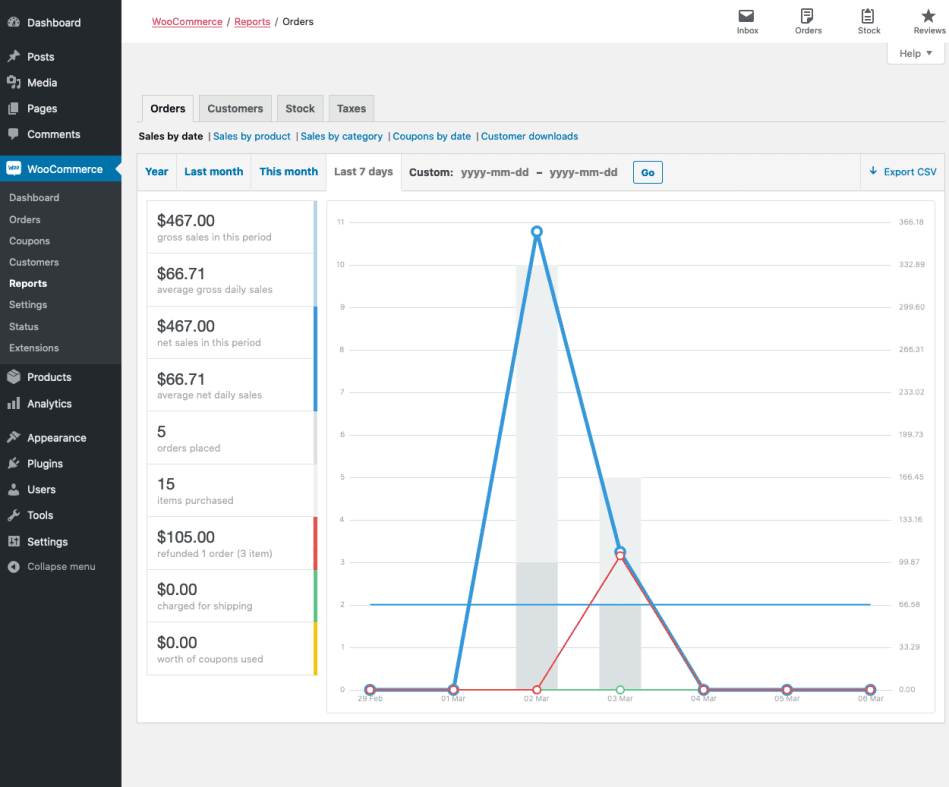
WooCommerce order reports / sales reports
View your gross and net sales volume and totals, top sellers, top freebies, top earners, and product downloads.
Note – By default, orders marked as Processing, On Hold and Completed are counted as sales.
These WooCommerce sales reports have further sub-sections:
- Sales by date – View your sales via a sales graph for different date ranges; by year, last month, this month, last 7 days, and a custom date range.
- Sales by product – Shows the sales per product based on different date ranges.
- Sales by category – View sales numbers by category.
- Coupons by date – Shows discounts in total and number of coupons used.
- Customer downloads – Downloads are tracked and logged as per a unique customer ID.
Customers report
This report gives an overview of customers vs. guests and a customer list (registered users) with options to further sort them by date ranges.
Stock report
Lists your low in stock, out of stock and most stocked products.
Taxes report
View your taxes by code (state) and taxes by date.
These are the basic WooCommerce reports. All these reports besides the stock one have the option to export to CSV.
For an advanced WooCommerce export, refer to these guides:
New WooCommerce analytics (little advanced)
The new WooCommerce analytics is a step ahead of the default WooCommerce reports.
It introduces new reports along with advanced filtering and segmentation tools.
You’ll find these reports under your WordPress Admin panel > Analytics.
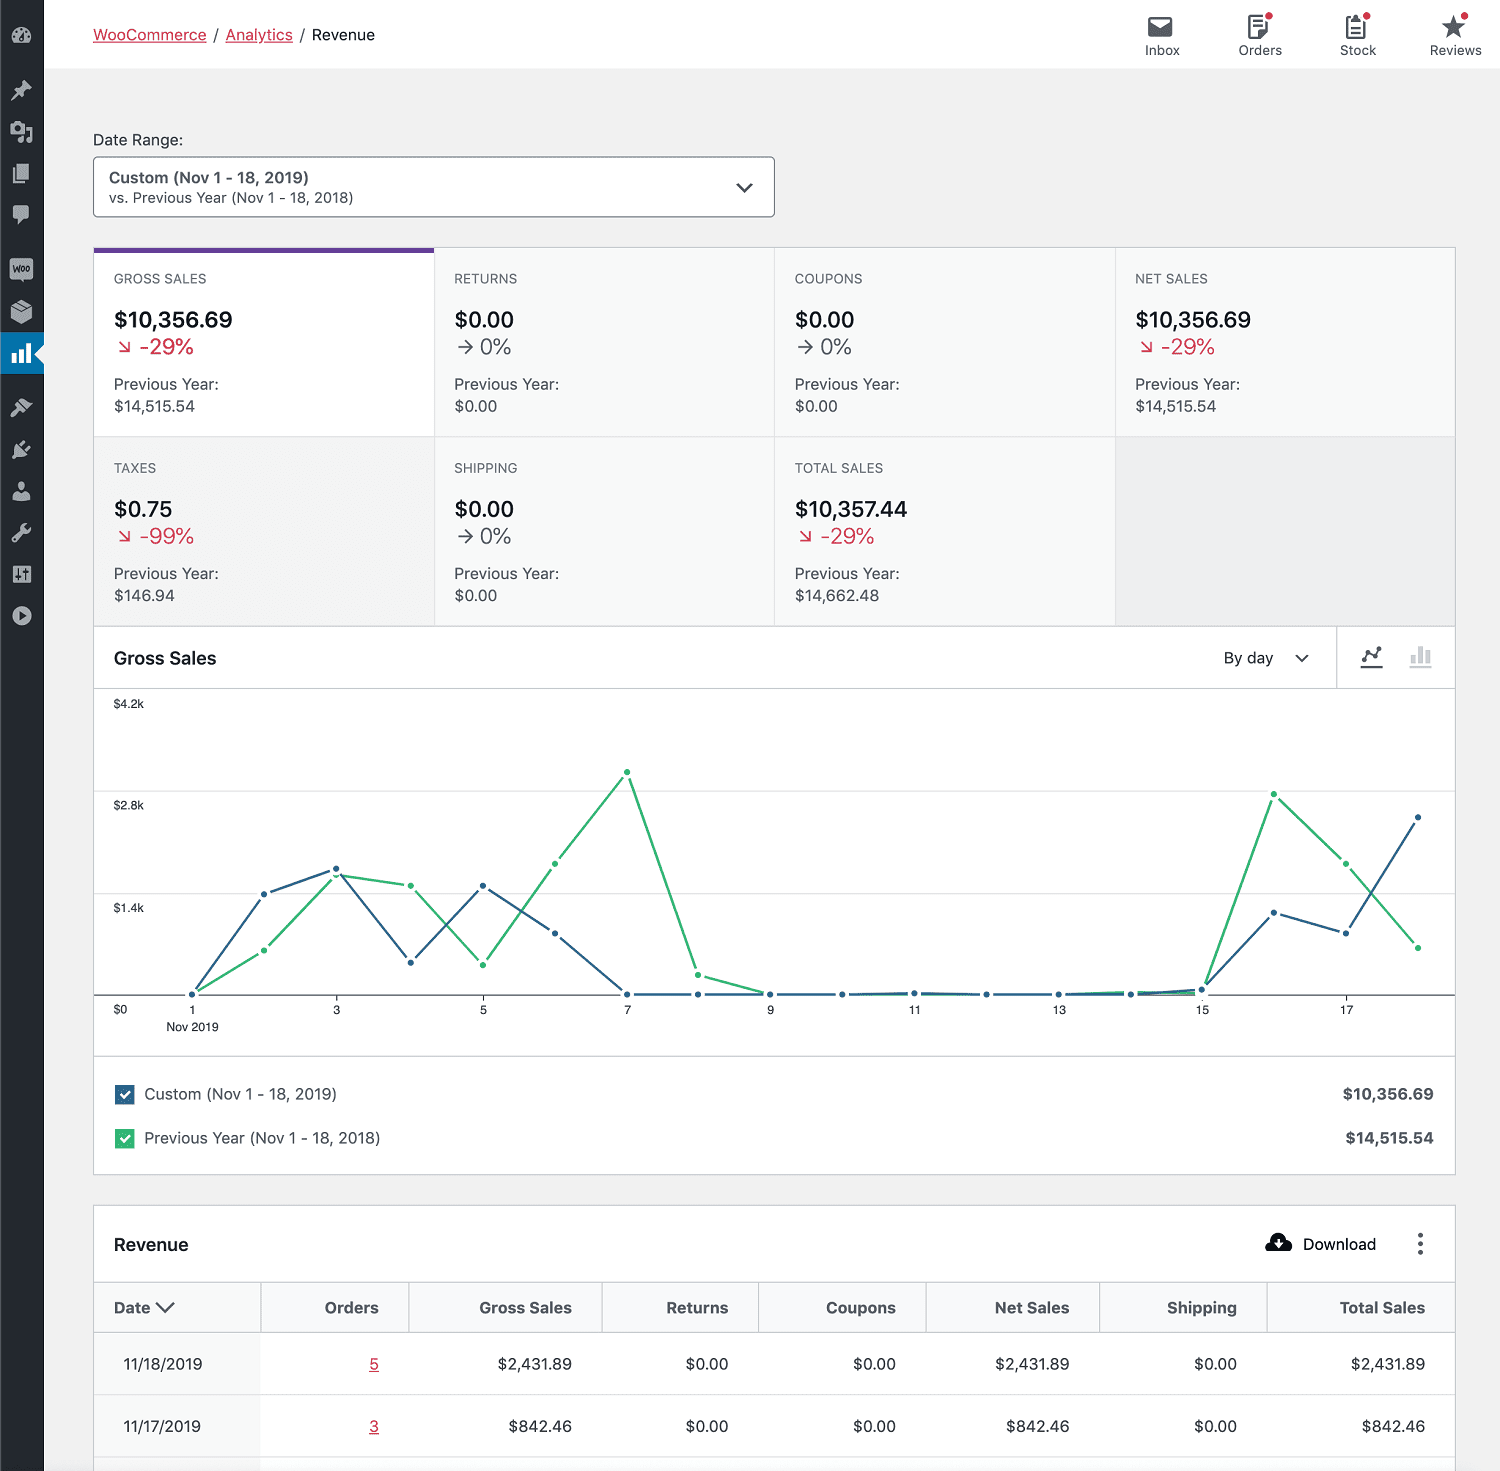
Revenue report
The Revenue Report provides insight into the daily revenue of your store. A row is included for each day to check for orders placed on that day.
Orders report
The Orders Report provides insight into your store’s orders.
The Orders report is sorted with non-excluded statuses in descending order by default. Excluded statuses can be edited on the Settings page.
However, refunded orders cannot be excluded from the orders report. Refunded orders have two rows in the report:
- Date of the original order
- Date of refund
You can filter data by order status, products, coupon codes, customer type, refunds, tax rates and product attributes to gain some insight.
Products report
The Products Report provides insight into the sales performance of each product in your store.
The report displays the All Products view by default. All products that fetched sales in the specified date range will be shown.
You can also use the checkboxes in the report table to select products for comparison.
Variations report
The Variations Report provides insight into the sales performance of each Product Variation in your store.
Categories report
The Categories report is sorted by the number of Items Sold by category in descending order by default. You’ll find the sales amount for a product included in the totals of all assigned categories. Know more.
Coupons report
Shows all the coupons for the selected date range. You can filter reports by coupon name and also compare coupons. Know more.
Downloads report
The Downloads Report provides insight into the performance of your store’s downloadable products.
Stock report
The Stock Report provides insight into your store inventory. This report is available only if the Enable stock management option is checked.
Taxes report
The Taxes Report provides insight into taxes collected on your store.
Customers report
This report is separate as you will find it under WooCommerce > Customers.
You will find some interesting metrics for your customers – where they live, when they may have registered, and how they’ve spent money. You can also filter customers by specific names, country, average order value, etc. Know more.
These reports seem quite better than the basic WooCommerce reports. However, these reports also lack when compared to what the best WooCommerce analytics plugins have to offer:
- Overview of metrics and not deep insights.
- Only single store reporting. For multiple stores, you need to log in to individual stores.
- Simple filters for date, order type and order status, but not advanced.
- Slow and inaccurate data is reported sometimes.
- No in-depth segmentation.
- No subscription metrics.
Long story short, for a better and exact view of how your business is actually performing, you need to switch to a solution that eliminates all the drawbacks.
Is Putler the best advanced WooCommerce reporting tool?
Putler provides you with an accurate representation of your WooCommerce business performance – sales, orders, customers, products, and subscriptions. This helps you to make data-driven decisions.
Putler offers more than simply reports and analytics. It offers forecasting, filtering, custom segments, CSV export, and comparison features to offer a thorough understanding of your WooCommerce business.
It also integrates different payment gateways and e-commerce platforms, including PayPal, Stripe, Shopify, Google Analytics and others, and dedupes data (eliminates duplicate data and consolidates them into one) so that you receive accurate and real-time information about your store.
Here’s what Putler’s advanced reports for WooCommerce and other platforms include:
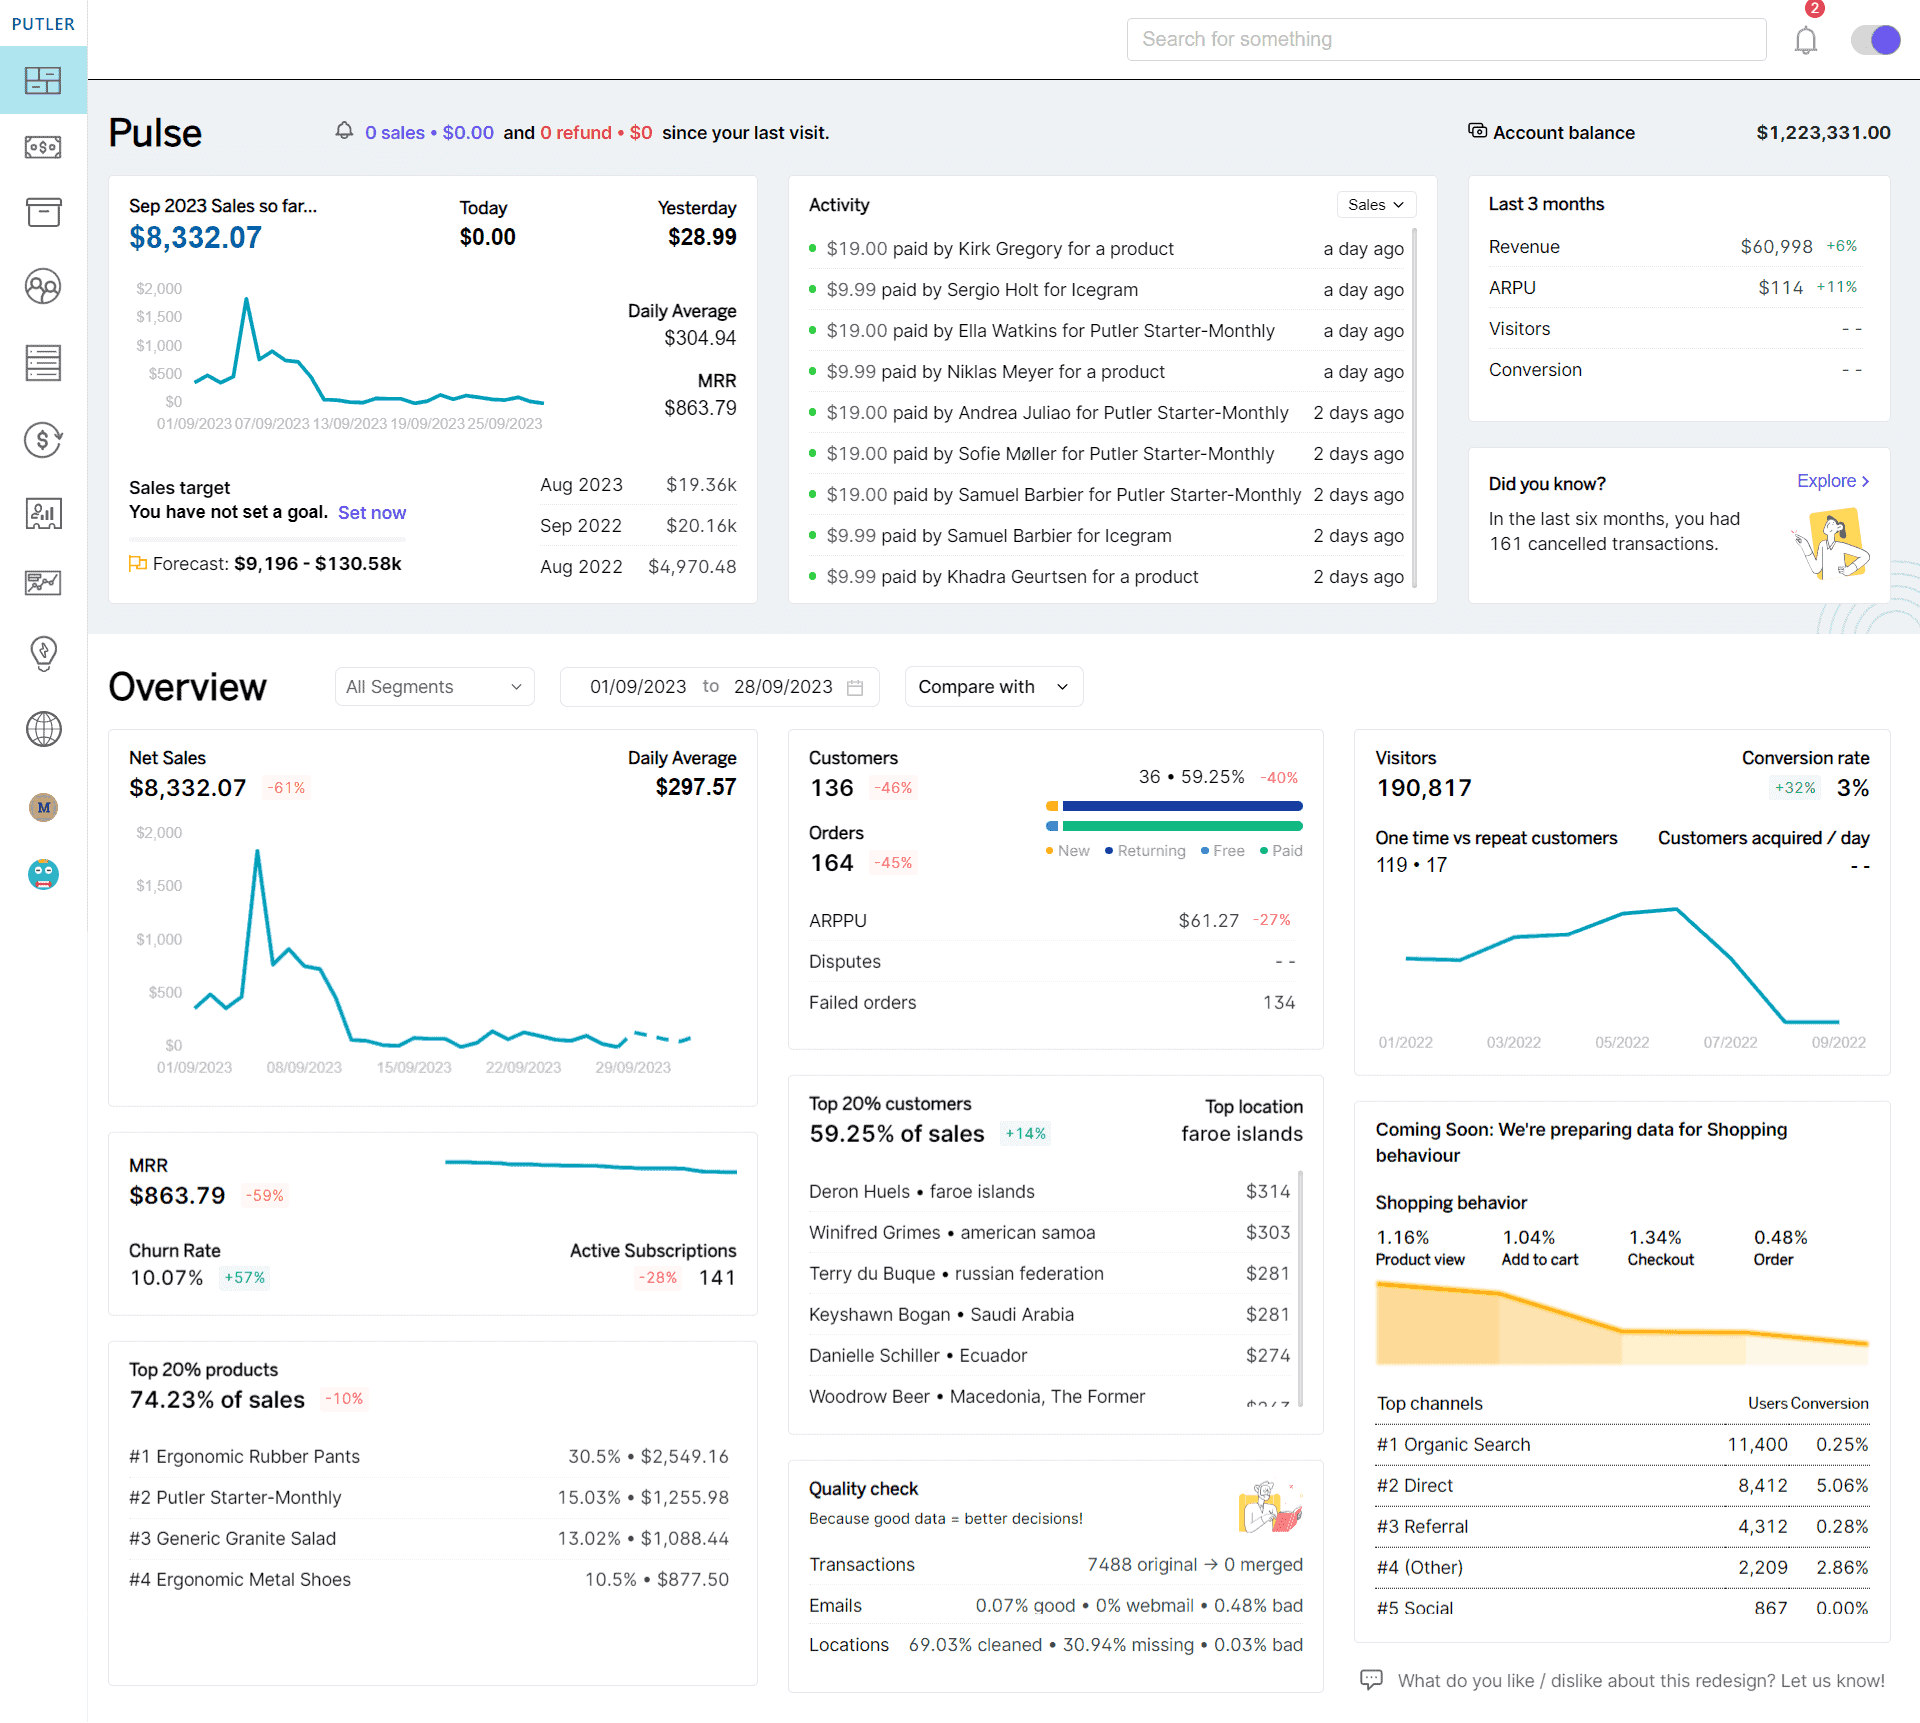
Home dashboard
Putler provides an overview of your entire business by showcasing important performance indicators and financial health in one place.
Pulse provides real-time updates on sales, revenue and buyer activity, which allows owners to track their success and make solid decisions. The dashboard also provides insights into customer behavior, such as repeat purchases and top products.
Sales dashboard
The Sales dashboard provides an all-encompassing overview of a store’s key performance indicators (KPIs). It contains metrics like net sales, daily average, orders, average revenue/sale, refunds and more.
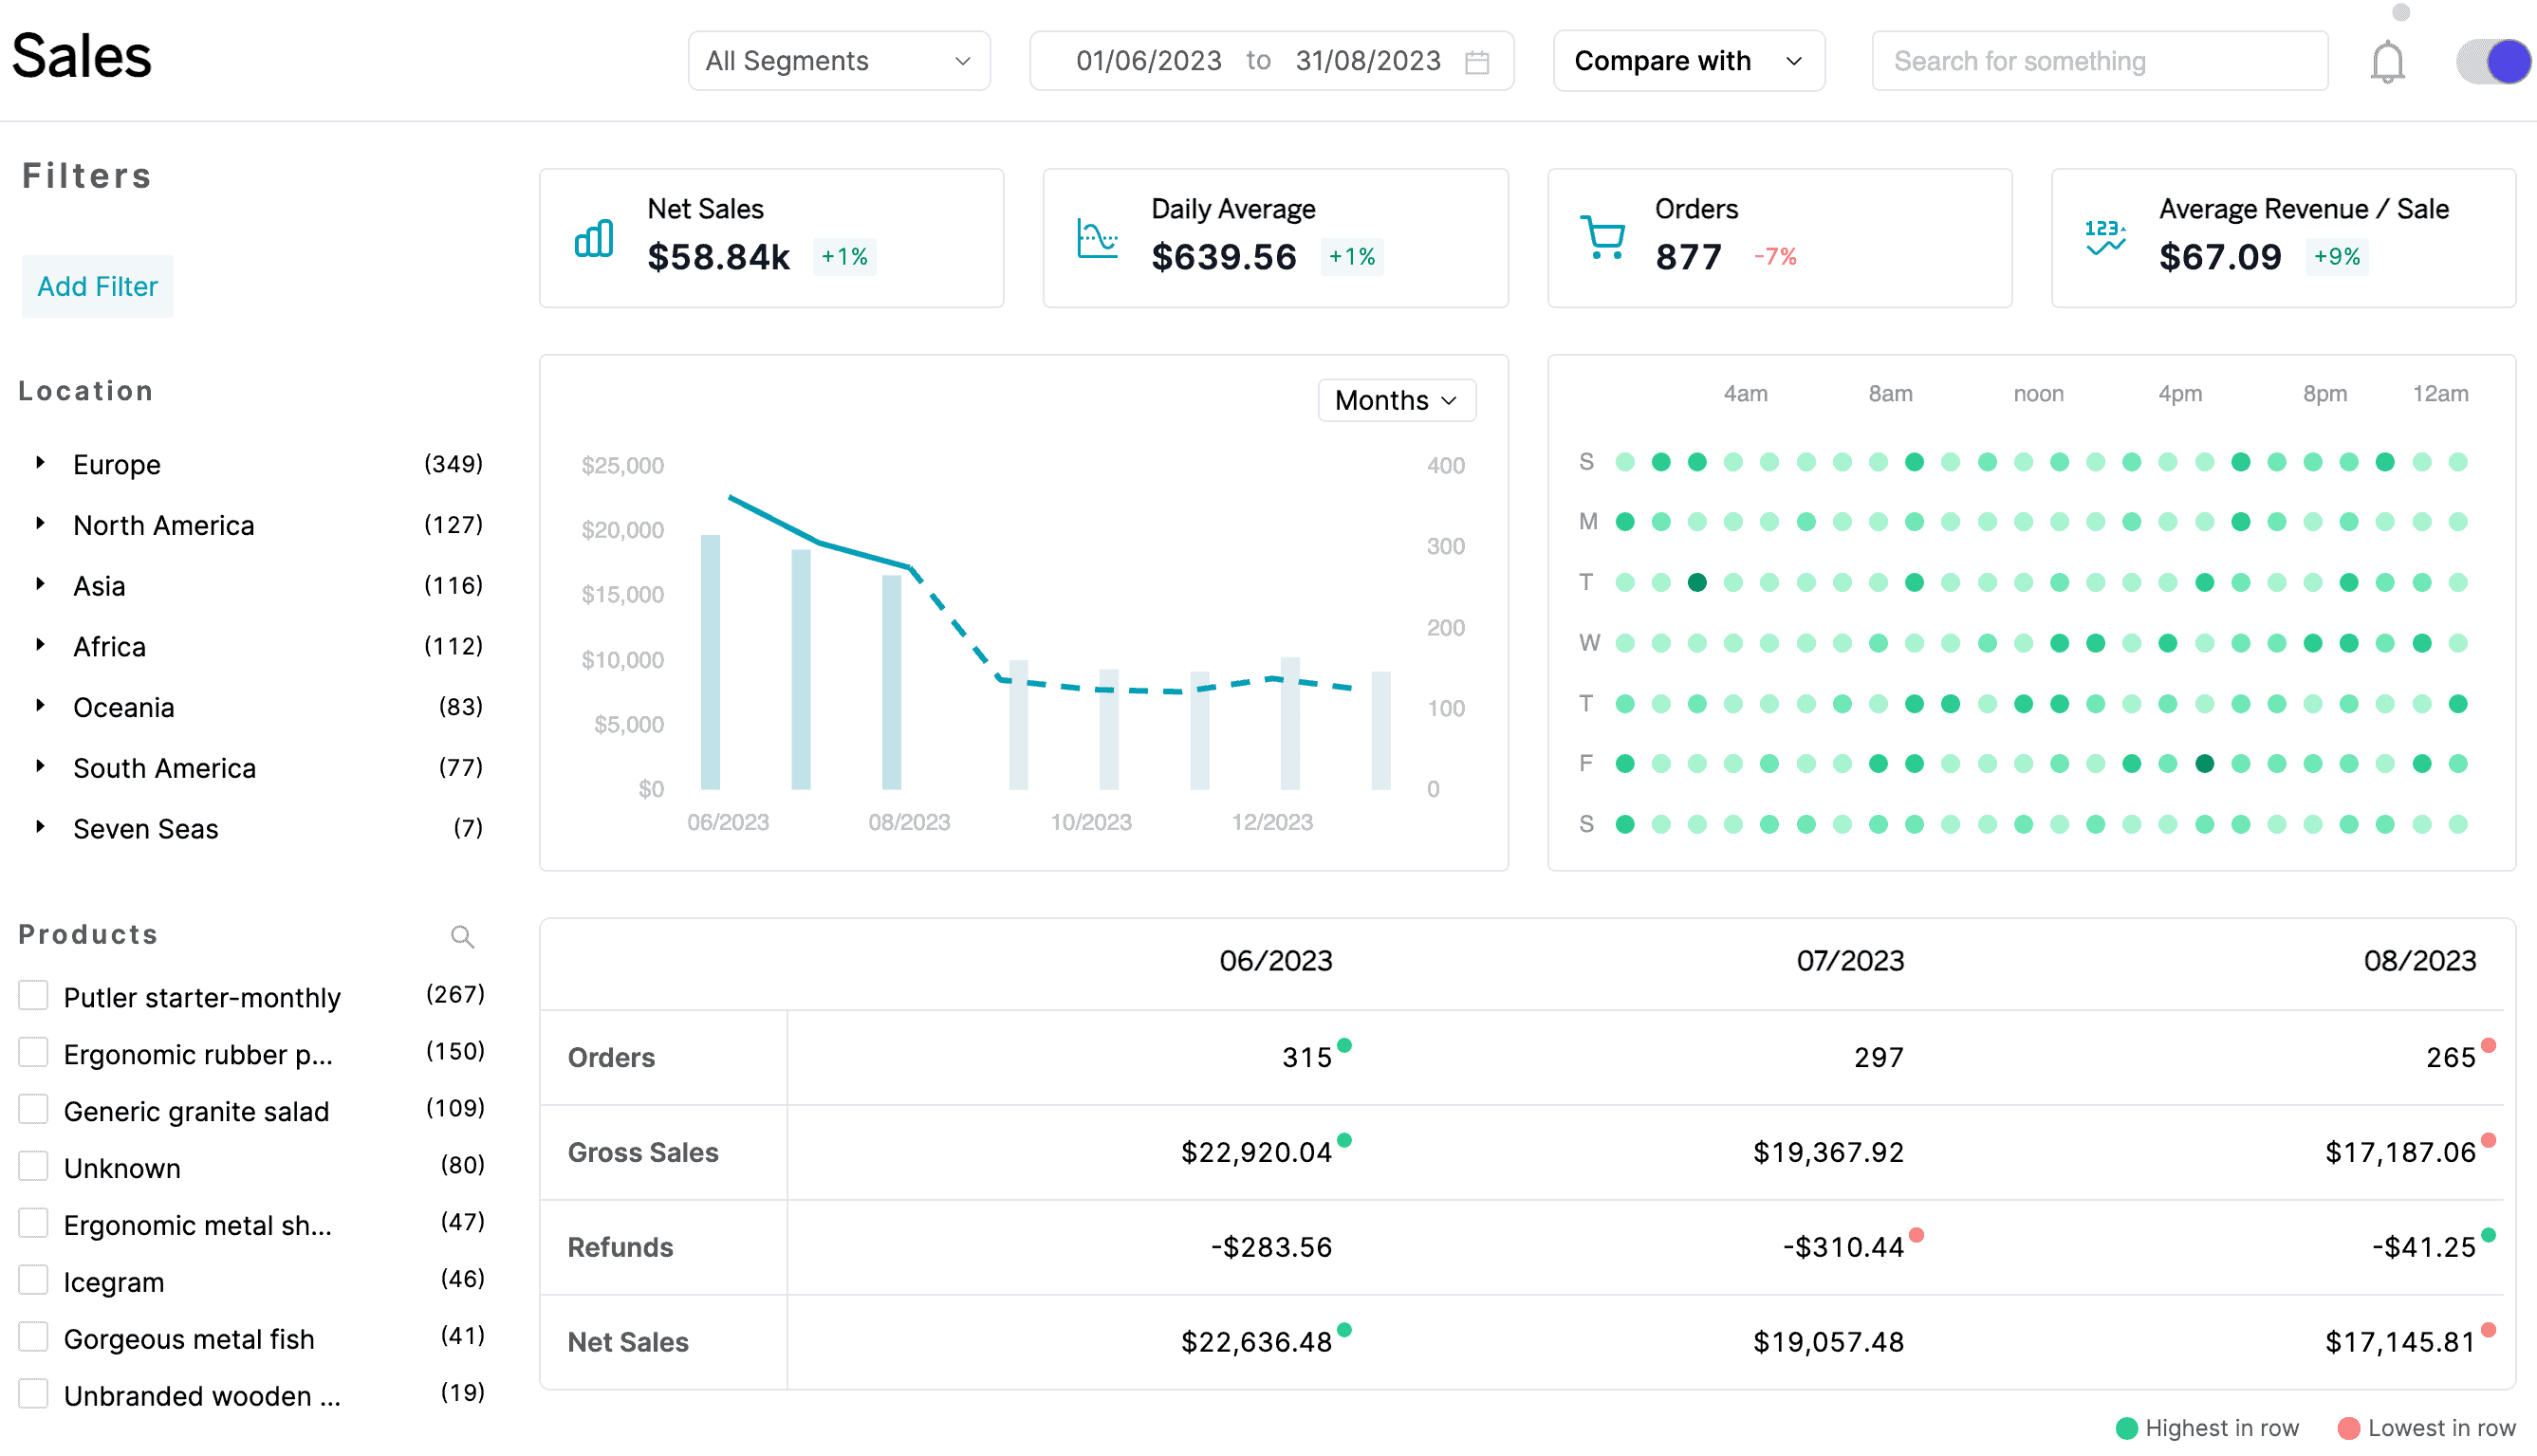
Store owners can use these KPIs to monitor the overall health of their sales performance, discover patterns and improve their sales strategy.
Products dashboard
The Products dashboard gives critical information about the performance of various products sold by an online store.
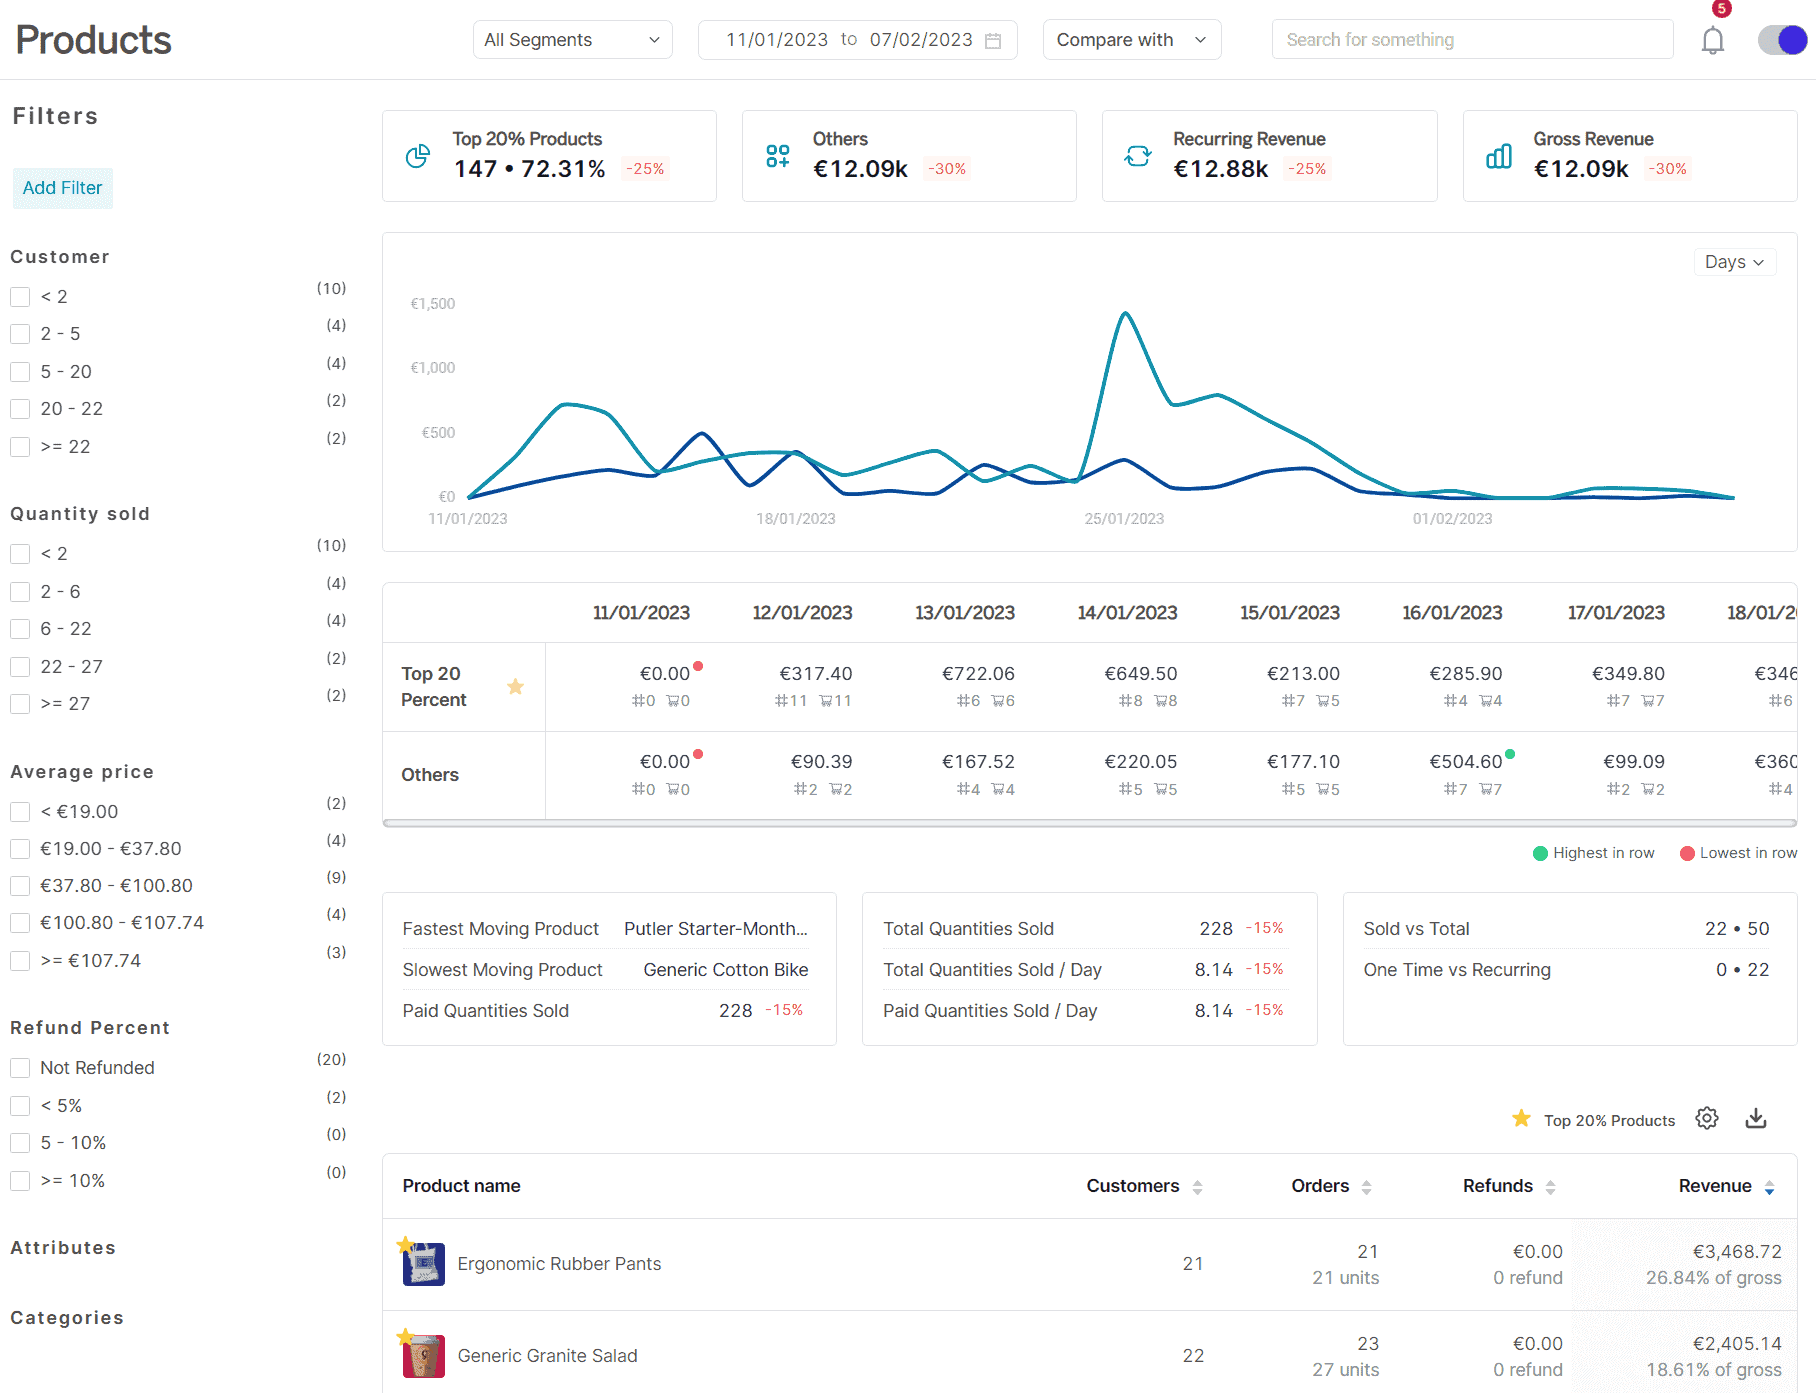
Here’s a brief of how it helps WooCommerce businesses:
- Performance analysis: Users can see which products are generating the most money, with a stark difference between the top 20% and the other 80%. This aids in understanding the primary revenue drivers.
- Sales velocity: Users can observe which products are selling quickly and which are moving slowly.
- Sales metrics: The dashboard shows the number of products sold, both in total and on a daily basis, providing a clear view of sales trends over time.
- Comprehensive product data: Users can access extensive metrics for each product, including customer orders, refunds, and income produced, to get a complete picture of product performance.
Users can also look further into specific product characteristics, such as sales and refund amounts, customer refund rates, customer buy patterns, sales histories and products commonly purchased together.
This comprehensive data enables store owners to optimize inventory, increase customer satisfaction and improve overall business performance.
Customers dashboard
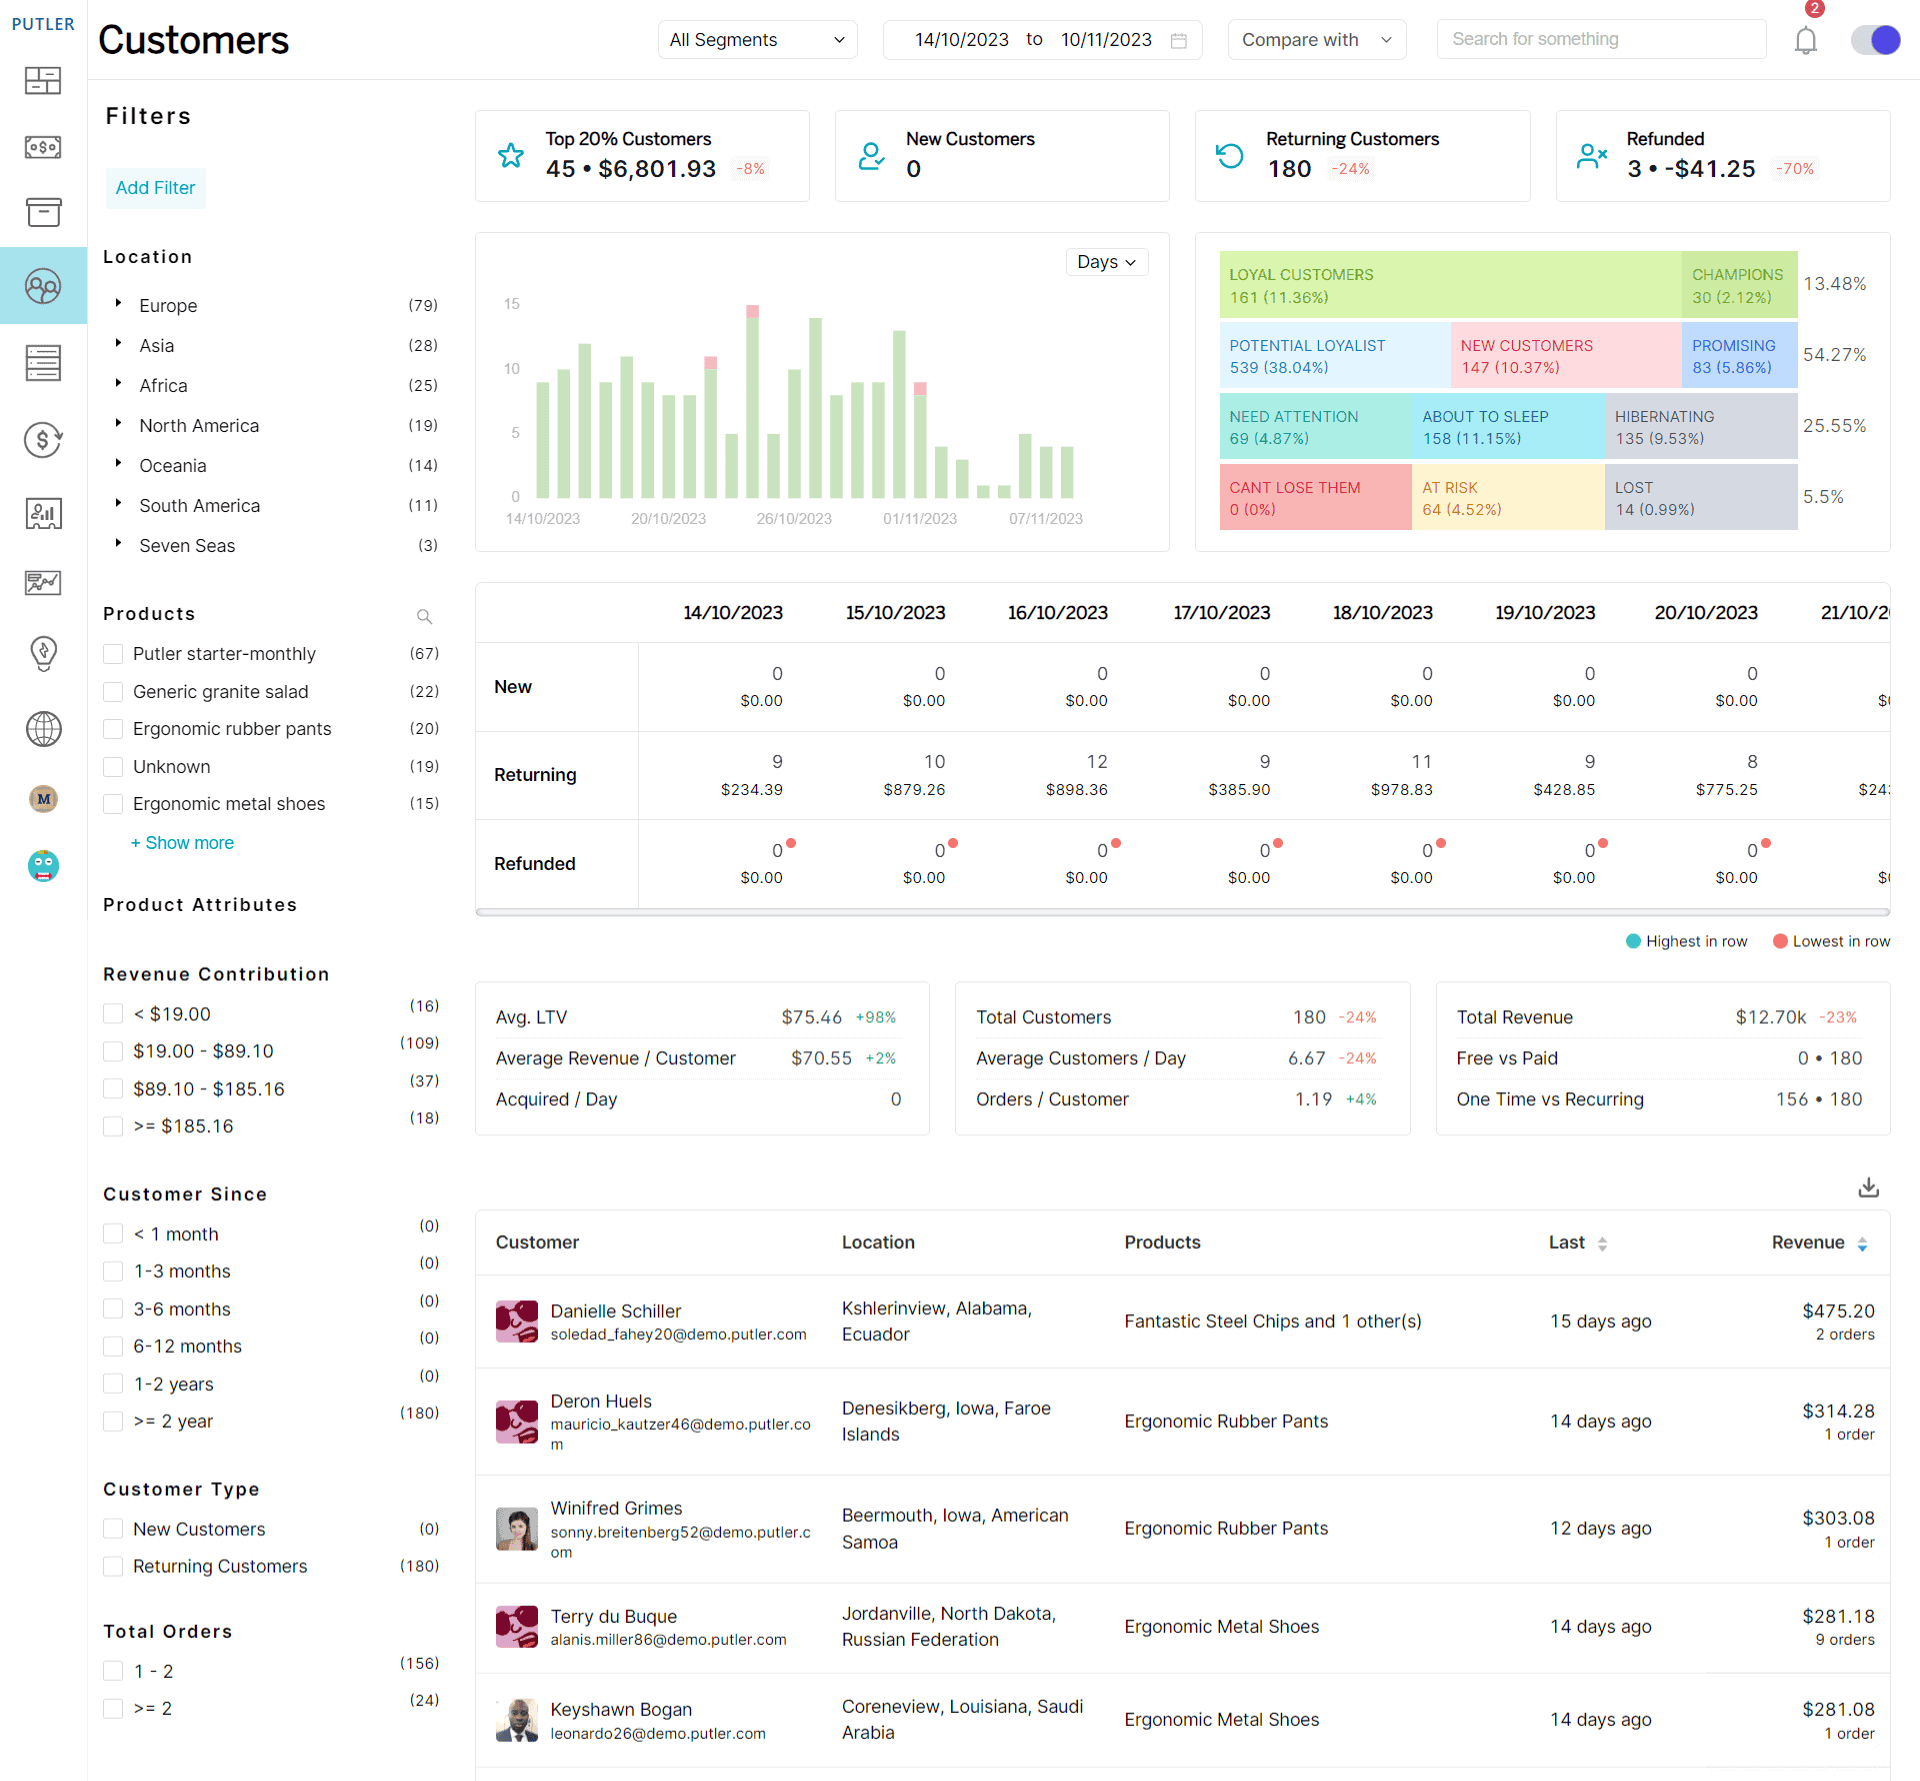
Putler’s customer dashboard is critical to do a range of customer analyses. So, here are some useful things that you can do and experience from this dashboard:
- By identifying your biggest buyers, you can give these valuable clients personalized attention through exclusive offers, loyalty programs or VIP treatment. Nurturing high-value customers ensures optimal revenue.
- The RFM analysis and other filters allow targeted marketing. For example, send abandoned cart emails to one-time buyers but loyalty coupons to recurring customers. This level of personalization improves conversion rates.
- Understanding which products are one-time vs. repeat purchases helps refine stocking and bundling strategies. You can upsell complementary items or plan new product development tailored to customer needs.
- Predicting an average LTV helps justify investment and resources for prospecting, onboarding or loyalty programs. You gain insight into expected returns over the long run customer relationship.
Transactions dashboard
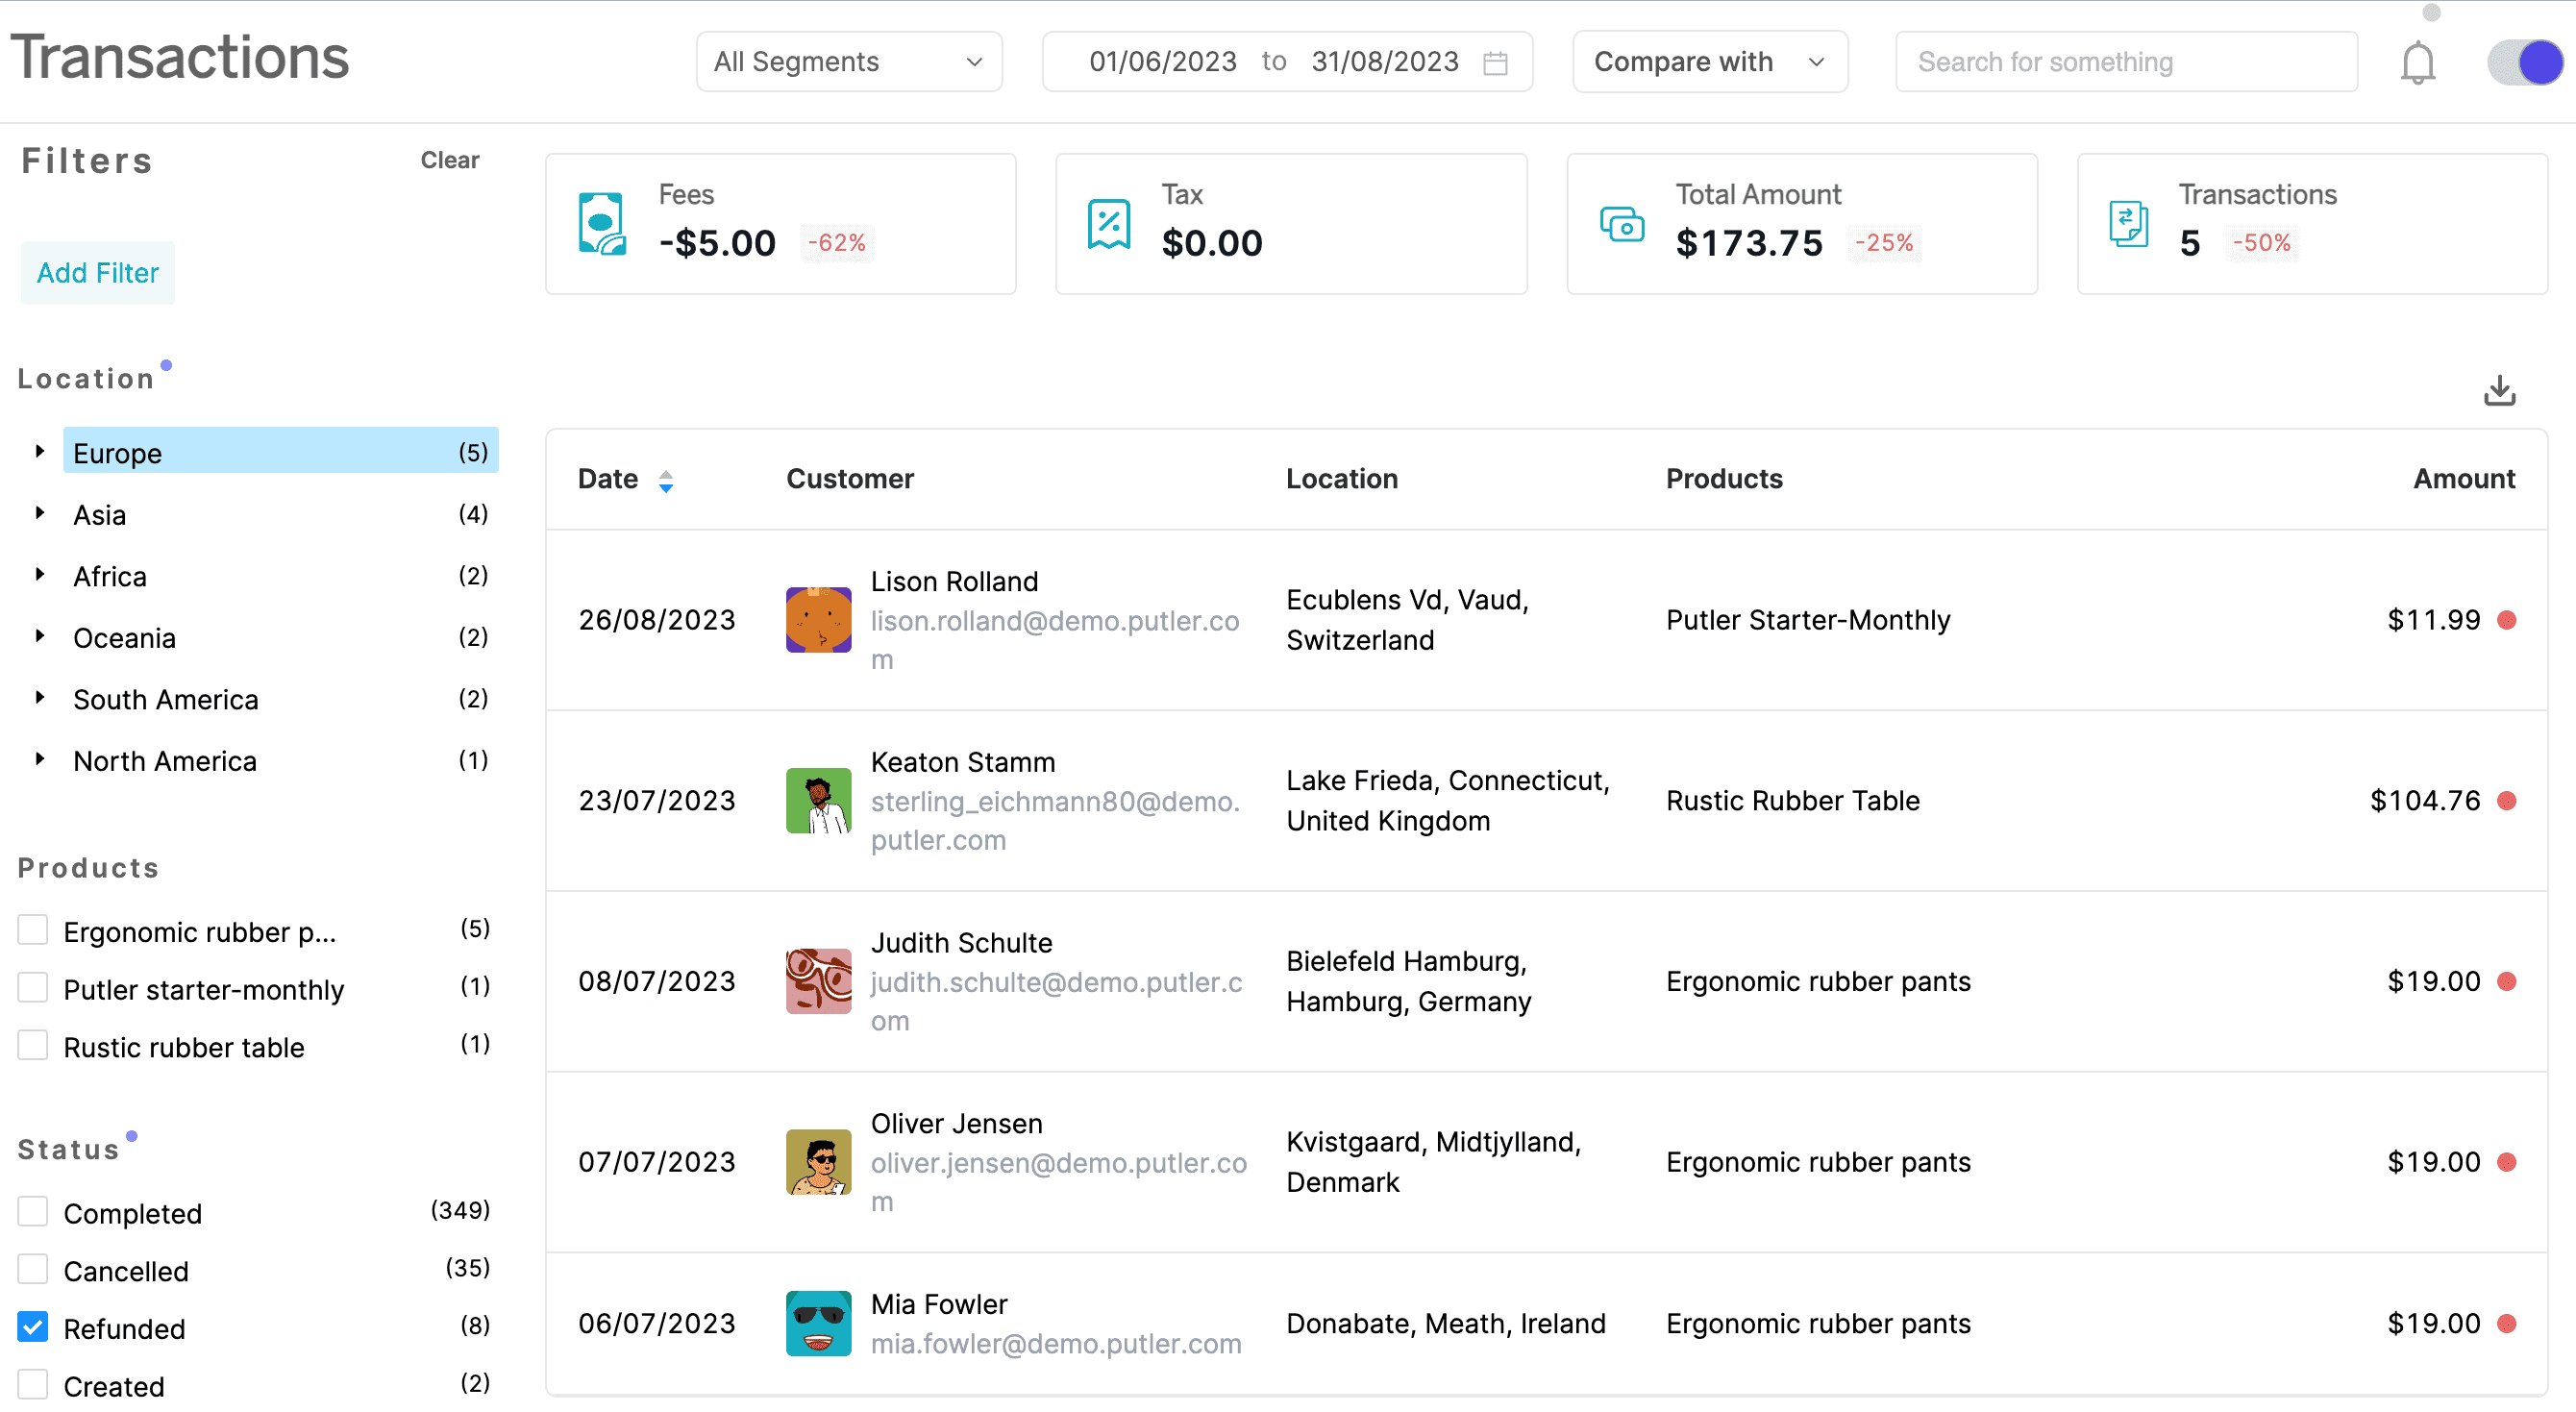
Here are the key metrics that you can find in this dashboard:
- Total amount, total transactions: These KPIs provide an overview of revenue generated and transaction volume.
- Fees and taxes: Breaks down the fees and taxes connected with each transaction. You can evaluate their influence on profitability and regulatory compliance.
- Transaction details: Displays a complete picture of each transaction, including customer information, product information, transaction status and financial information.
- Transaction kind: Categorizes transactions based on their kind (e.g., sale, refund, discount), which helps understand the causes of revenue changes and identifies areas for improvement.
Subscriptions dashboard
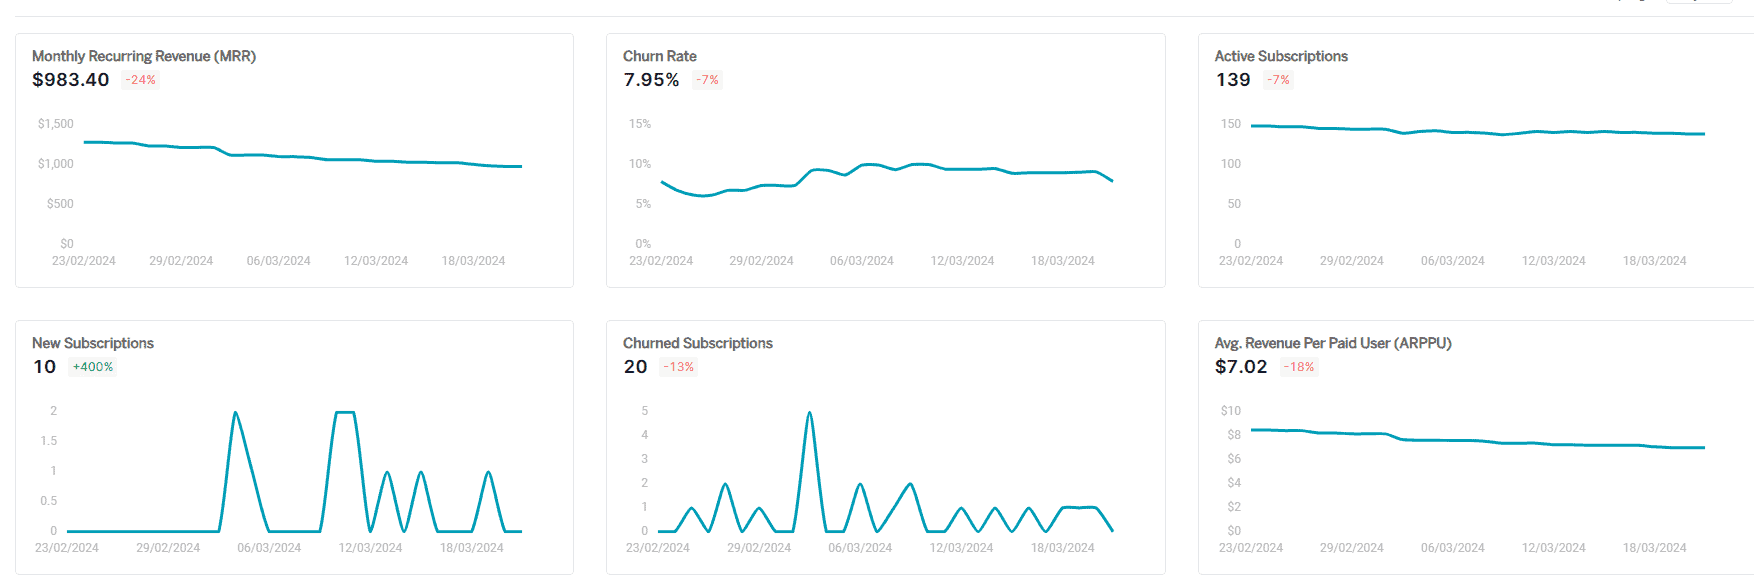
The Subscriptions dashboard includes key indicators for tracking the performance of any WooCommerce subscription-based services. Here’s an overview of the important things that you find with this dashboard:
- Revenue tracking: It allows users to track their monthly subscription revenue, which helps them understand their company’s financial stability and growth.
- Subscription growth: The dashboard displays the number of active subscriptions and new subscribers, giving away a clear picture of how the subscriber base is growing over time.
- Customer retention: By evaluating the frequency with which customers cancel their subscriptions, users can assess customer satisfaction and retention, identifying areas for improvement.
- Average revenue per user: Users can calculate the average revenue generated per user, providing information on customer value and pricing efficacy.
- Customer lifetime value: The dashboard allows users to predict the total revenue expected from a subscriber over the whole period of their subscription, which aids in long-term financial planning.
- Churn analysis: Users can better understand the reasons behind customer turnover and create strategies to lower it by determining the number of subscription dropouts.
Audience dashboard
The Audience dashboard, which is a unique feature of Putler, pulls in the most important metrics from Google Analytics (your website’s data) and displays them.
In short, the Audience dashboard provides a snapshot of your website’s performance. Putler can gather data from your website and make it available in a single place or dashboard. It has the following key performance indicators (KPIs).
- Total visitors/customers
- Visitors from the top five countries
- Channels: Evaluate marketing effectiveness by source (organic, referral, social, direct, email).
- Most popular pages
- Search terms
- Device category
Time machine dashboard
The Time Machine dashboard is a major component of Putler designed for advanced forecasting.
This allows you to forecast future growth using key performance indicators (KPIs) including monthly revenue, user growth and visitor conversion rates. It enables store owners to simulate various situations and assess the potential impact on their business indicators.
Managing multiple WooCommerce stores with Putler
Not just a single store, Putler is equipped to manage several WooCommerce stores. Simply connect the desired number of WooCommerce stores to Putler and monitor them all from a single window.
You can track all of your WooCommerce stores together or individually.
There is no need to navigate between your WooCommerce businesses to watch each store’s reports.
This is why Putler is a highly regarded WooCommerce advanced reporting tool.
Other powerful Putler features
- Export products, customers, orders and transactions to CSV.
- Restrict access to analytics and reports so that only dedicated people can monitor data.
- RFM analysis: automatic customer segmentation based on their shopping behavior.
- Advanced comparisons: even across multiple stores.
- Weekly summary report emailed to your/team’s inbox.
Conclusion
WooCommerce reporting is a big deal for store owners as it guides them toward improved insights and decision-making.
If you’re struggling with outdated or inaccurate WooCommerce reporting, you can switch to Putler to access a full spectrum of KPIs for sales, customers, transactions, products, etc.
Putler enables you to realize your online store’s full potential by providing detailed sales dashboards, client segmentation, forecasting, and multi-store management features.
Get Putler now and move towards a comprehensive dashboard for all advanced analytics.
FAQs
How many users does Putler have?
Putler is trusted by over 7,000+ users. Putler is used by numerous agencies, CTOs, marketing managers and financial geeks.
What is the total value of orders analyzed by Putler?
Putler has analyzed over $5 billion worth of orders, providing deep insights and analytics to help businesses grow.
How many transactions has Putler processed?
Putler has processed more than 60 million transactions. Putler has righteously demonstrated its capability to handle large volumes of data efficiently.
Does Putler support multiple currencies?
Yes, Putler supports 62 different currencies, which makes it a versatile tool for global eCommerce businesses.
Is Putler a good fit for my small WooCommerce business?
Putler is a great asset for any WooCommerce store or business including small-scale WooCommerce stores. Here’s why it’s amazing for starters and aspiring eCommerce sellers.
- A 14-day free trial lets you test its features risk-free.
- Putler means affordable and scalable too. Start with a basic plan and upgrade as your business grows.
- Putler lets you gain more insights about your business. It’s a great tool for anyone who is into financials, marketing/sales, customer and eCommerce management.
This is a very informative article. Thanks for sharing these helpful articles.